Chamath Versus Everyone: Concerning performance of the King and his SPACs
At Unusual Whales, there’s a feature that tracks Furus and the stocks they mention. In this report, we’ll take a deeper dive into the SPAC King: Chamath PalihapitiyaTLDR:
- Judging by reported yearly returns, Chamath’s SPACs performed SPACtacularly in 2020 during the bull market.
- However, 2021 has been a challenging test for Chamath with his SPACs suffering significant losses, and a clear disconnect from market and industry performance.
Introduction and the overarching questions:
A Special Purpose Acquisition Company (“SPAC”) is a publicly listed blank check firm usually expected to find a private company to merge with and go public in a 2-year timeframe. Once considered the “backdoor” to public markets, SPACs have garnered huge media attention due to the sheer number of SPACs being created, deals being made, and money exchanged in 2020. The fanfare has also brought about skepticism, criticism, and regulation. Chamath Palihapitiya “is a Canadian venture capitalist, engineer, SPAC sponsor, and the founder and CEO of Social Capital.” He’s become quite a celebrity in the finance world and has been dubbed the “King of SPACs” following a string of high-profile deals. In Social Capital’s (SC) annual investor letter, both of SC’s SPACs and private investments had impressive double-digit returns. SC’s claimed returns dwarfed those observed in the S&P500 during the same time period. The letter even included a cheeky comparison to Warren Buffett’s Berkshire Hathaway. While the returns themselves are correct, we should be skeptical of the story conveyed. This report will take a deep dive into the data and try to determine whether Chamath is truly the King of SPACs, or whether the media might have inflated his success. This report will also try to tease out factors owing to Chamath’s observed success and whether any of those insights can be used by retail investors.
General Methods:
- Dissect Chamath’s SPAC assets and obtain an overview of the greater SPAC landscape.
- Benchmark his SPACs performance to the market, to specific sectors, and to other SPACs within the same timeframe.
- Identify patterns in the data.
- Examine events surrounding his SPAC performance to see if it is a random chance or driven by Chamath himself.
Results:
Chamath’s SPACs cover a variety of sectors, with biotech being the newest addition
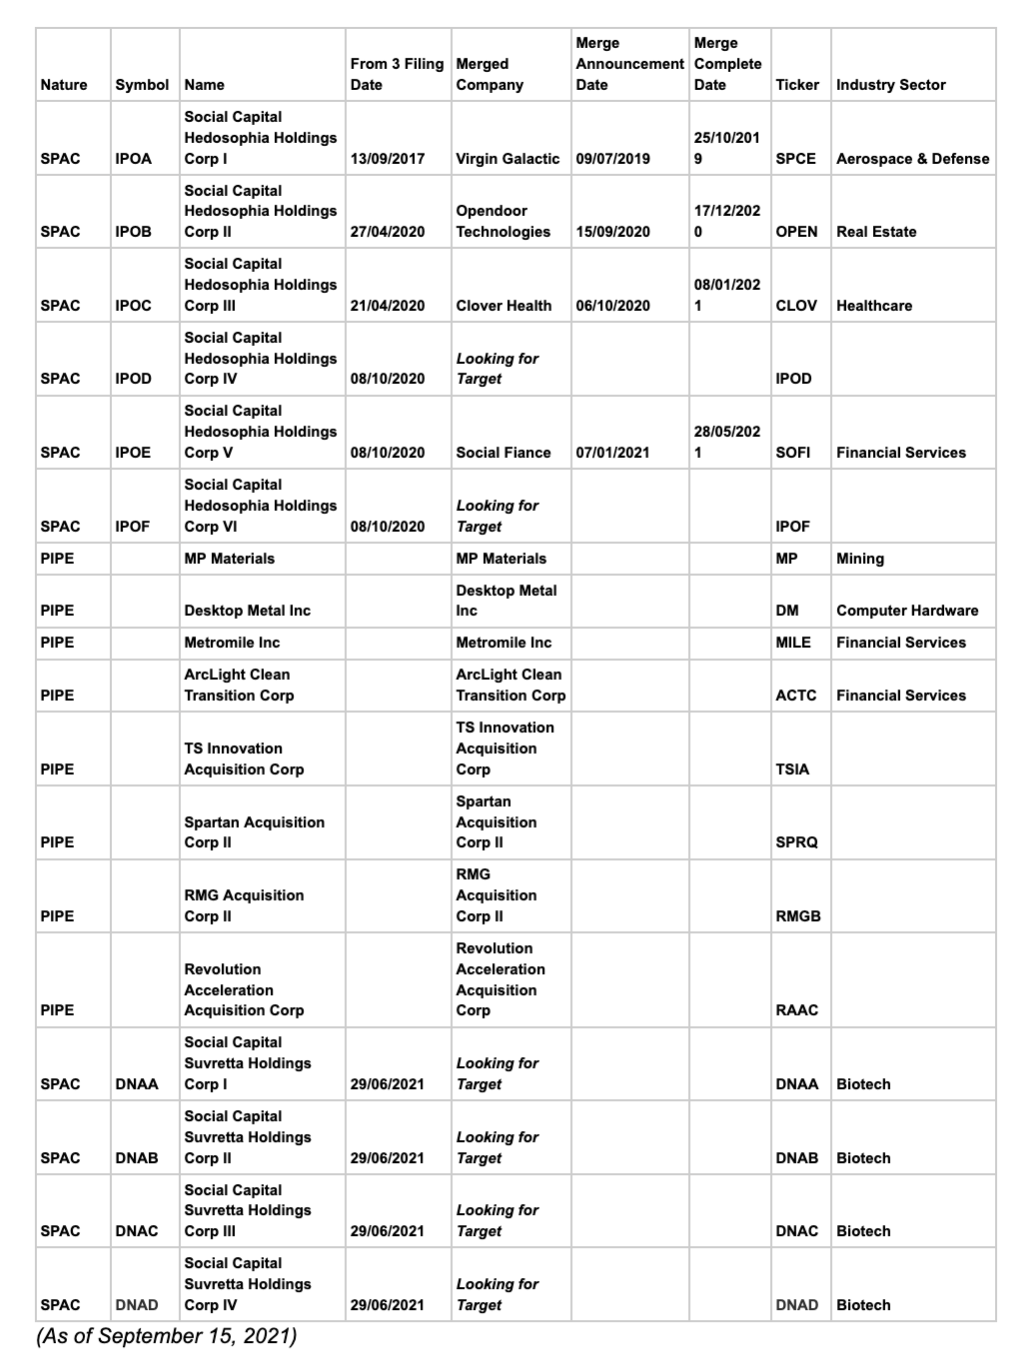
All SPAC-related deals are tabulated in Table 1 to give an overview of Chamath’s SPAC landscape. Of note, the PIPE deals are included in this table for your interest but will not be analyzed in detail due to this report’s scope and the scarcity of data. Merger announcements and completion dates are listed and used later in time series analyses. The majority of Chamath’s SPAC deals were in the last year. IPOA to F SPAC deals have ventured into diverse industries like aerospace (SPCE) and financial services (SOFI). Meanwhile, the most recent SPAC filings broke away from his naming tradition “IPO-”, and instead began with “DNA-” and will be biotech-focused with possible merger topics in cancer-targeted therapies, immunotherapy, etc.
Chamath’s SPAC assets price history reveals high volatility compared to the to market
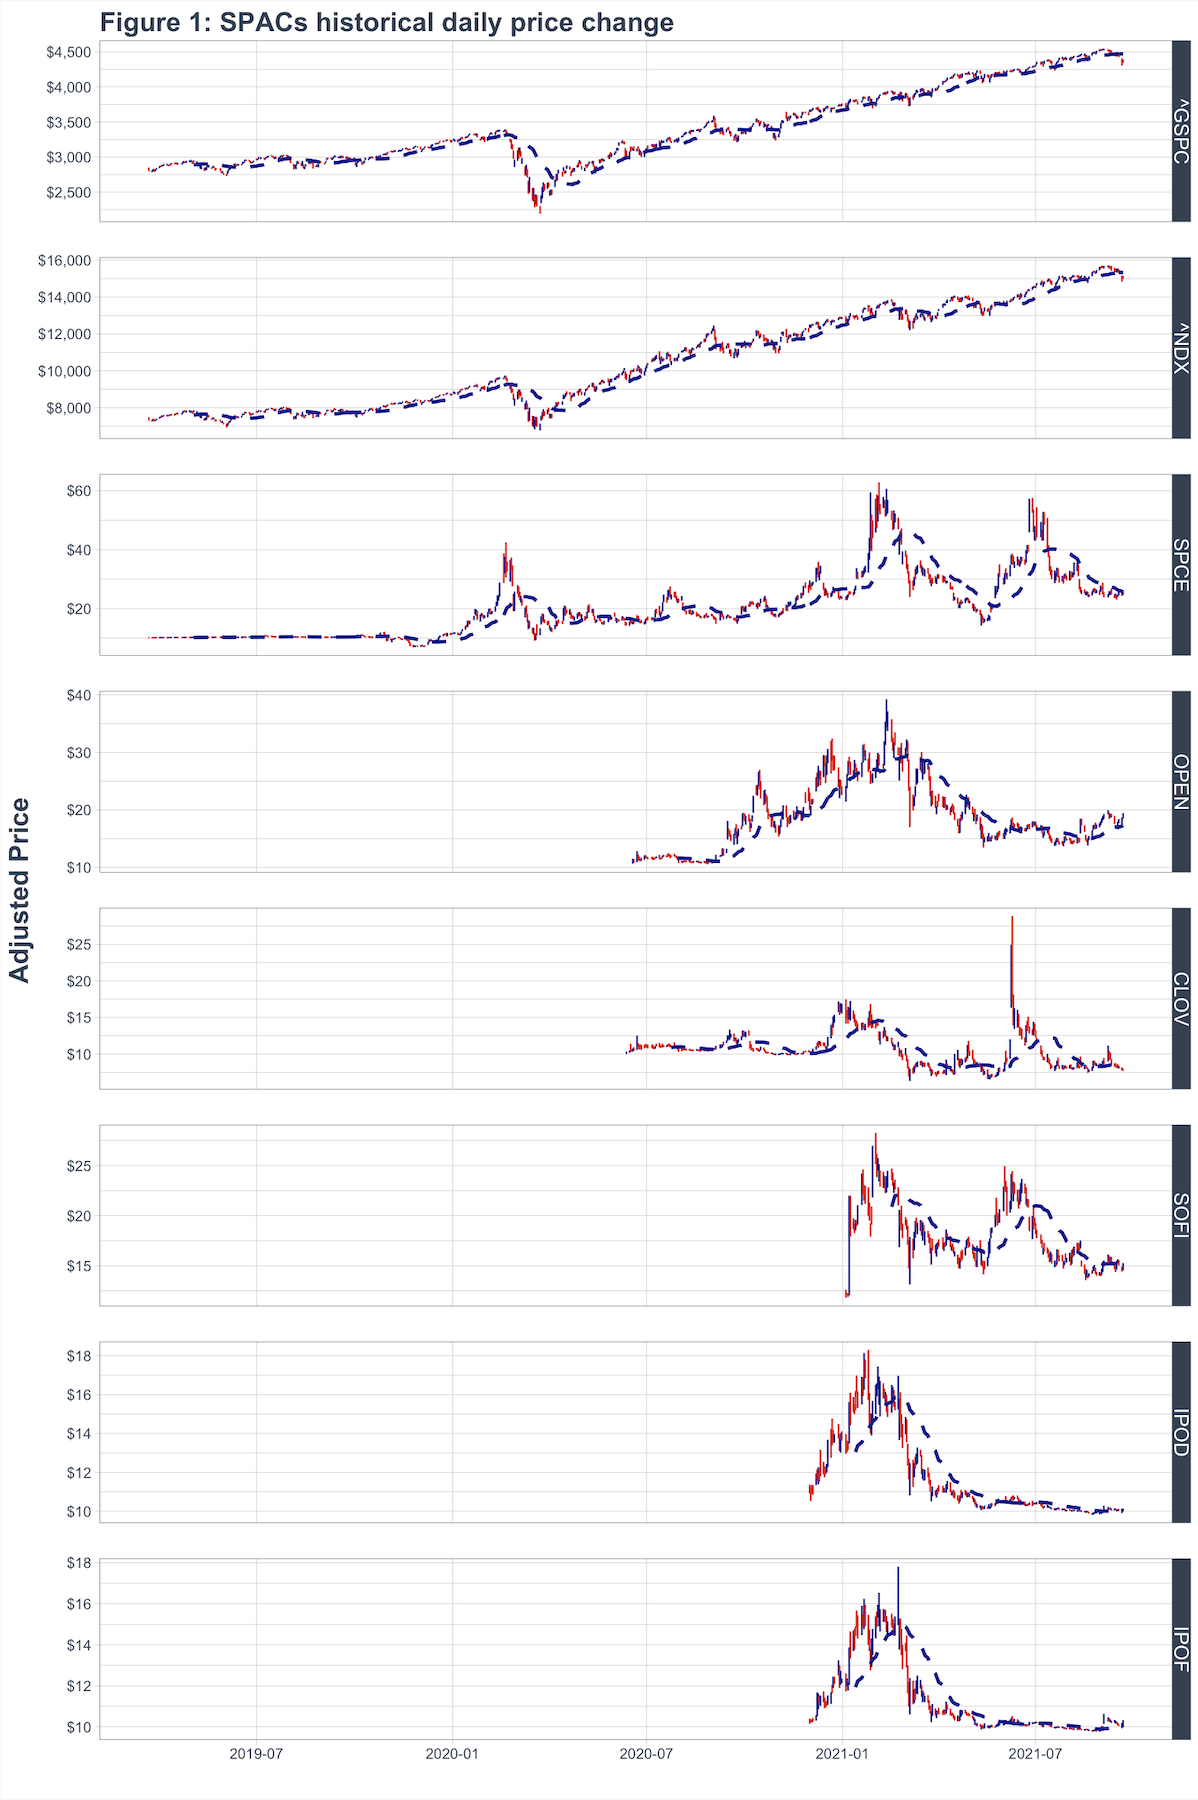
To examine Chamath’s SPACs, the first thing that comes to mind is to examine the historical price data available. Fig. 1 illustrates the daily price change in candle plots for each SPAC backed by Chamath in the past 30 months compared to market benchmarks S&P 500 (^GSPC) and Nasdaq 100 (^NDX). A blue dashed line representing the 30-day trading SMA (Simple Moving Average) is added to allow better trending detection for the underlying security. Although the underlying prices vary significantly in their dollar value, candle plots still indicate distinct movement compared to both benchmarks. SMA line further suggests Chamath’s SPACs share similar price patterns among themselves, but not to the market.
To visualise the price volatility on the same scale, weekly prices over the same period normalized to each stock’s own max~min range in Fig.2. Once the normalized weekly price movements are fitted into the same scale, 3 interesting observations become obvious:
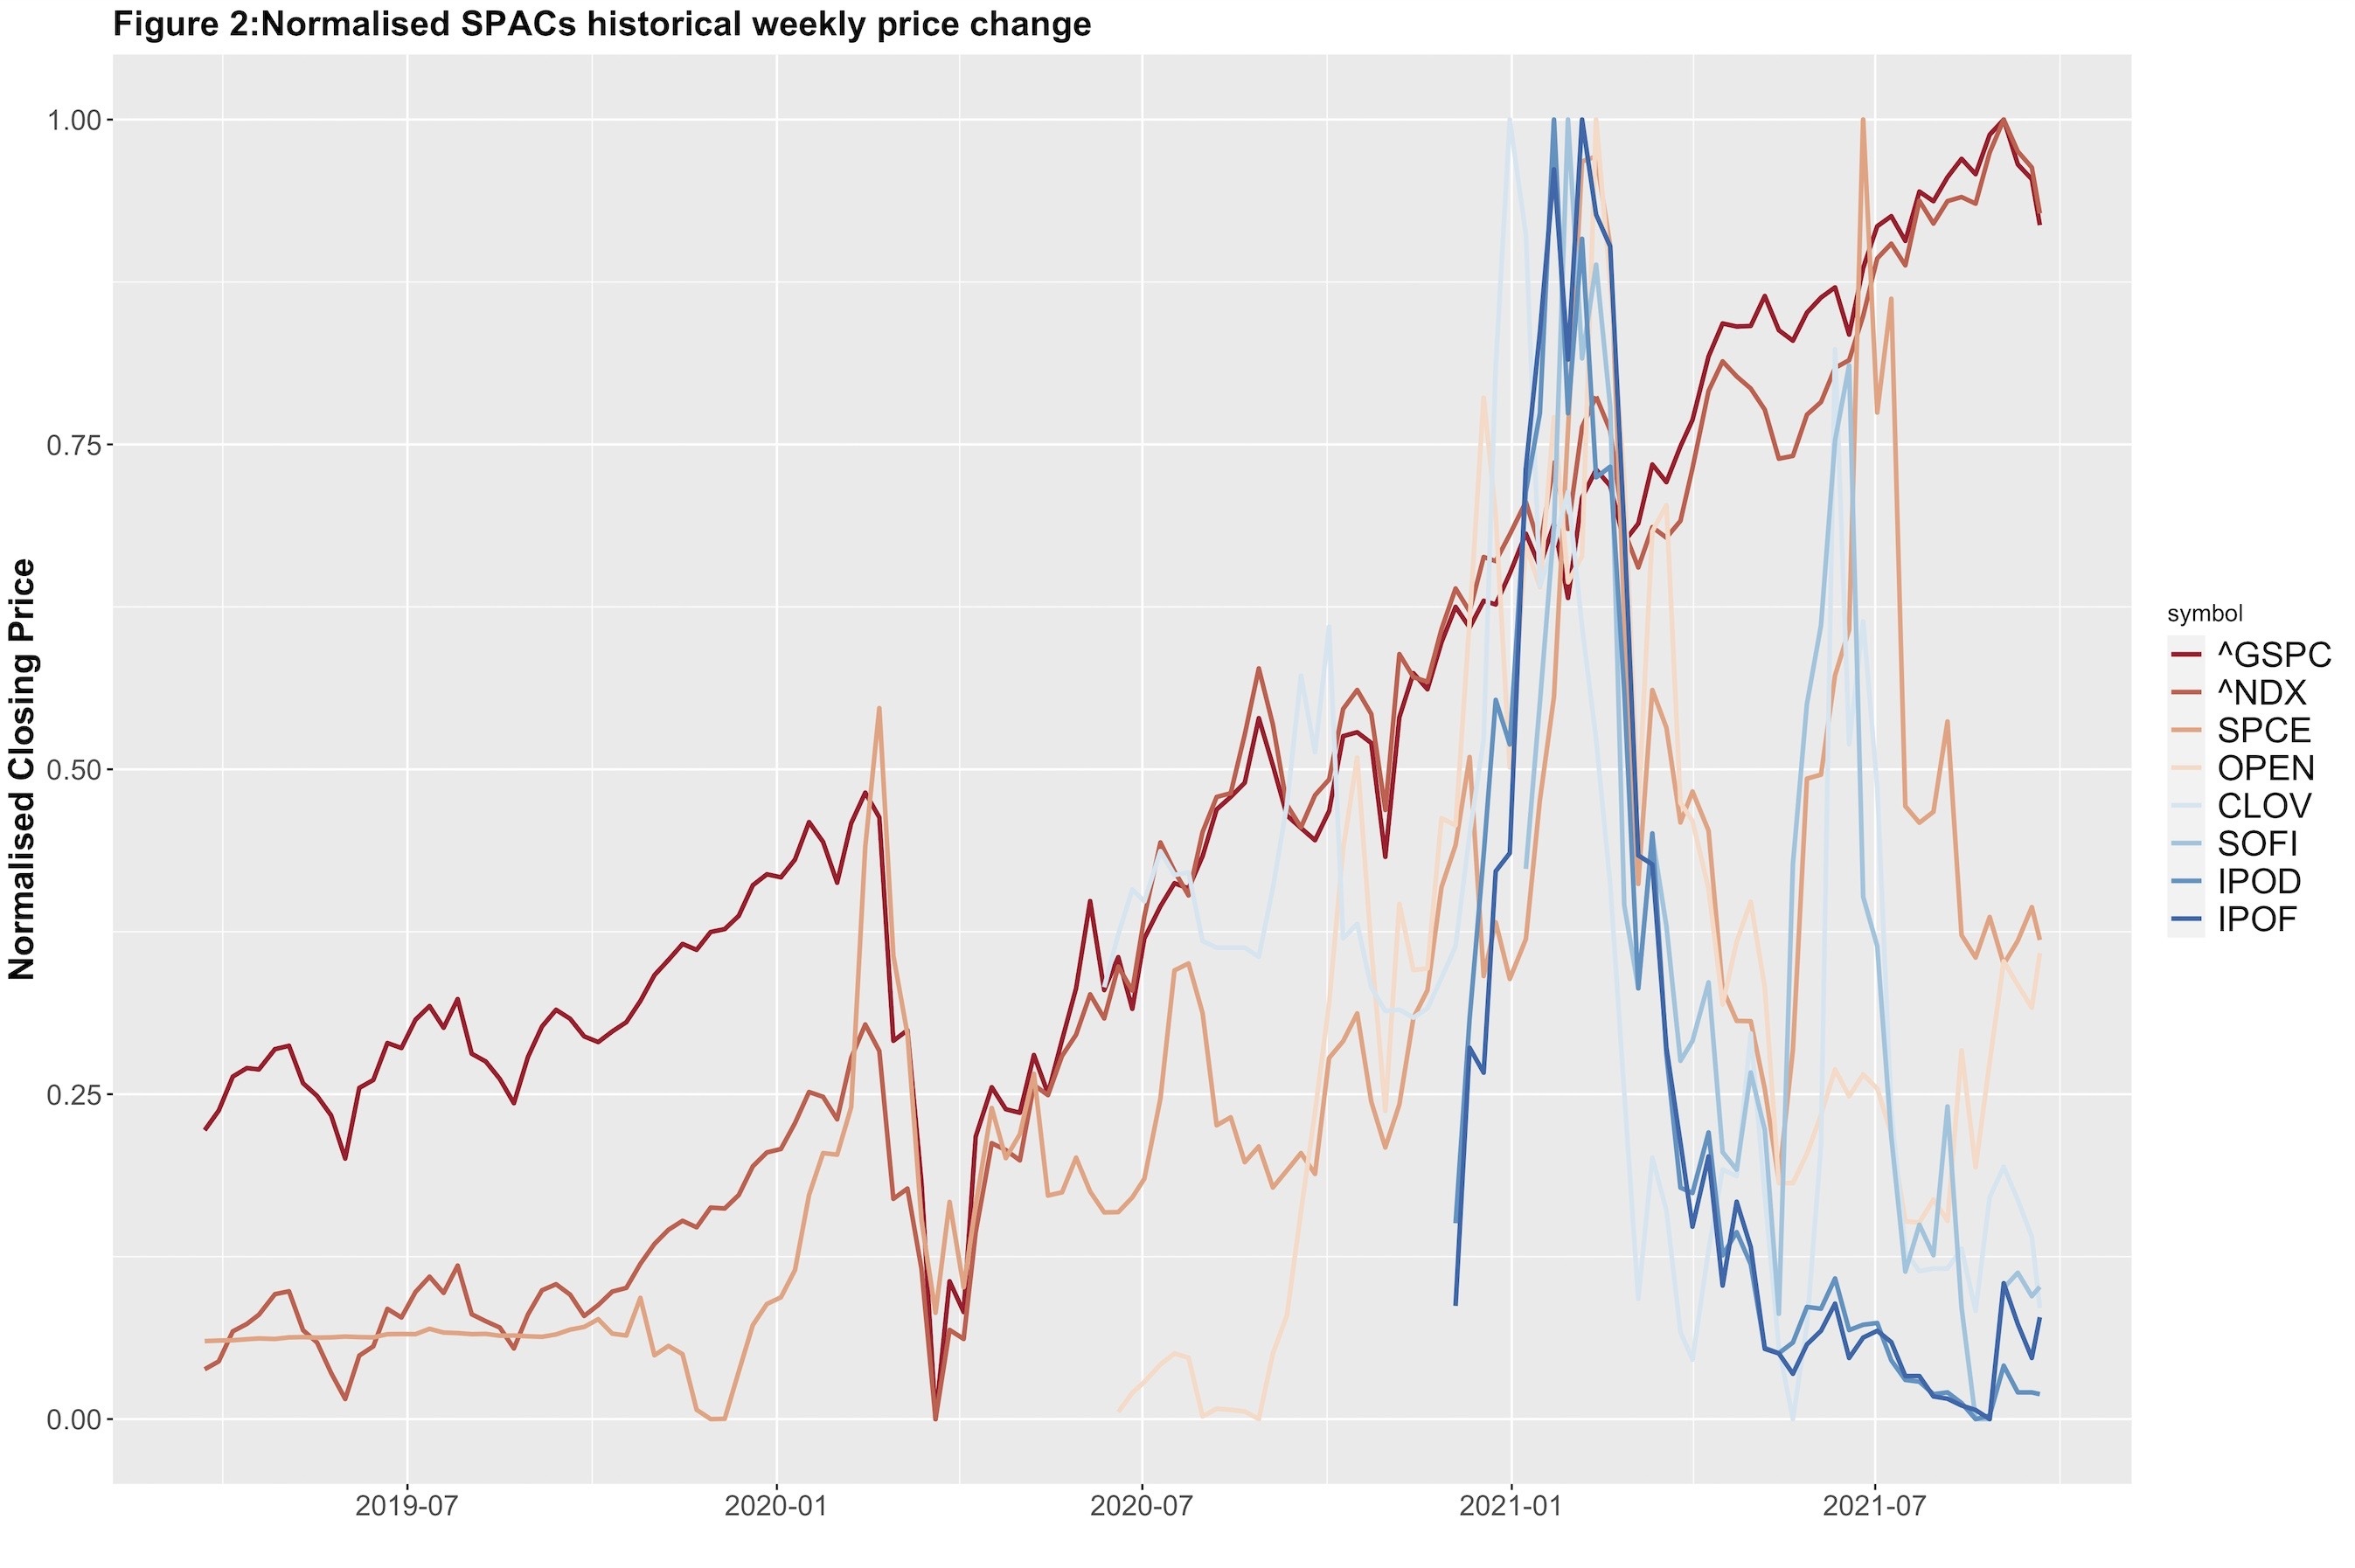
Virgin Galactic (SPCE, Fig.2 orange line) actually followed the market indices closely before and immediately after the 2020 crash in March.
From April 2020 onwards, SPCE deviated significantly both in trending pattern and moving magnitude to the market. This volatile behaviour was shared for all of the Chamath-owned SPACs .
IPOD and IPOF almost had identical weekly price movements in the past year.
To have a more quantitative comprehension of Fig.2, a quick test on pairwise correlation of daily price and trading volume between Chamath’s SPACs and market indexes are visualised in the heatmaps in Fig. 3 and 4, respectively. Due to the merger time difference (Table 1), only data from Jan 2021 onward was used to include more SPACs. Blue squares indicate a more positive correlation and the red ones suggest a negative correlation, pearson’s r values are given as labelled. As an internal control, market benchmarks S&P 500 (^GSPC) and Nasdaq 100 (^NDX) both correlated extremely well at daily price (r = 0.92) and trading volume (r = 0.8). This number suggests that the Nasdaq 100 hikes as the S&P 500 moves, which makes perfect sense when the supply-demand moves concordantly as the volume suggested. The difference in price movements in Fig.2 is consistent with the negative trending r values of Chamath’s SPACs to the benchmarks. Again, IPOD and IPOD correlate extremely well in price (r = 0.99) and trading volume (r = 0.91), suggesting a potentially paired trading scheme.
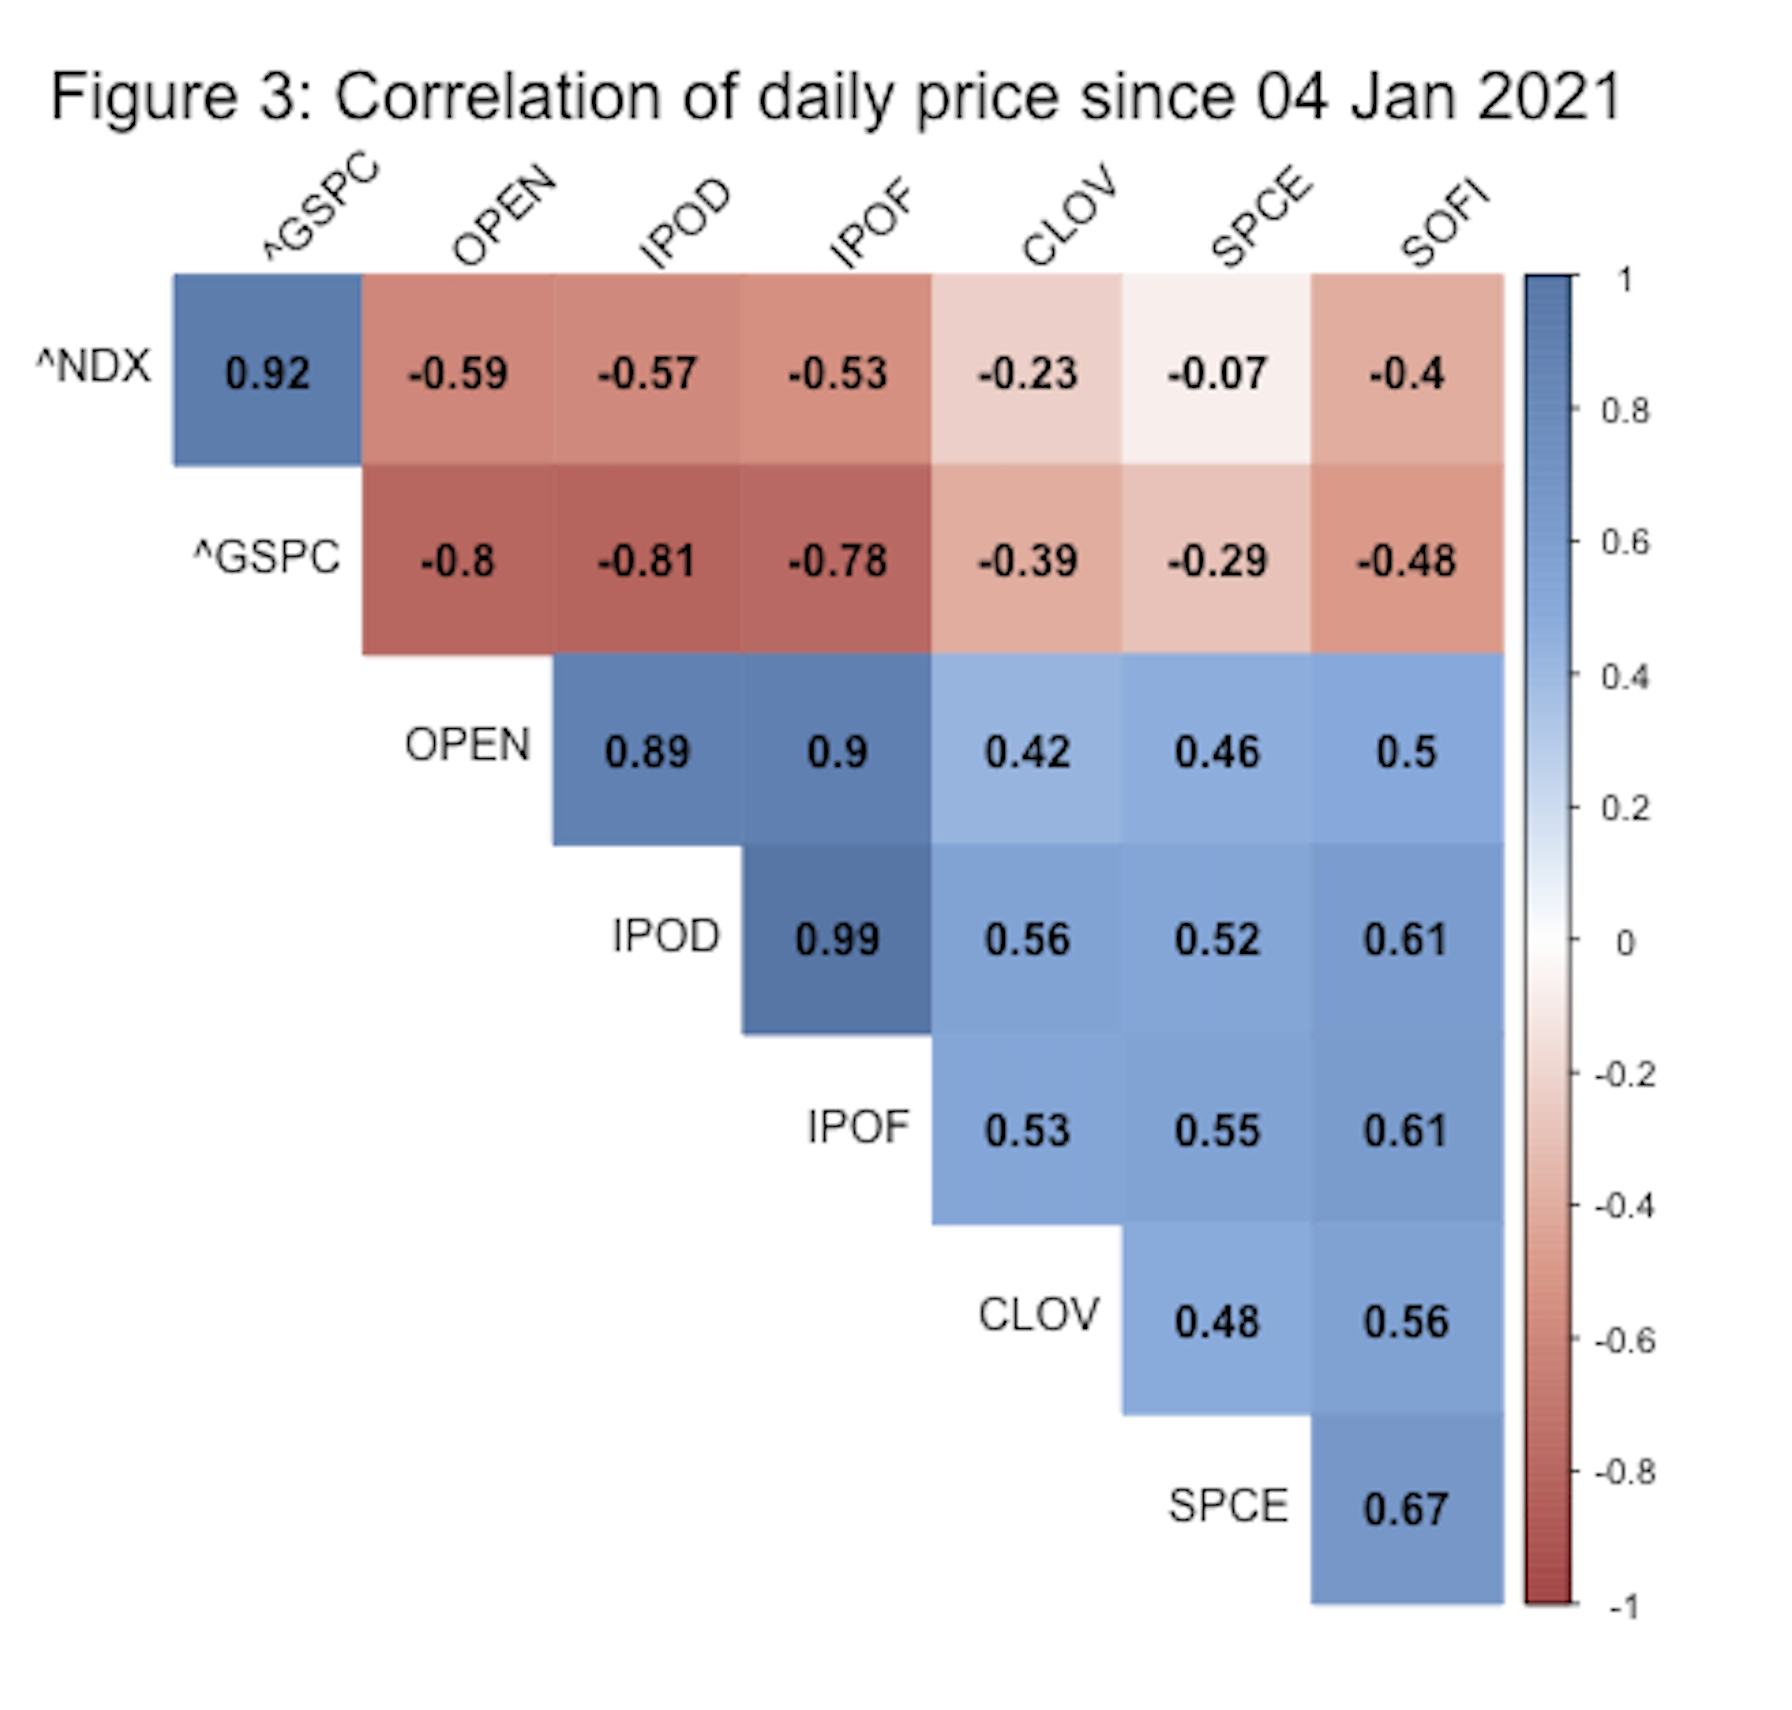
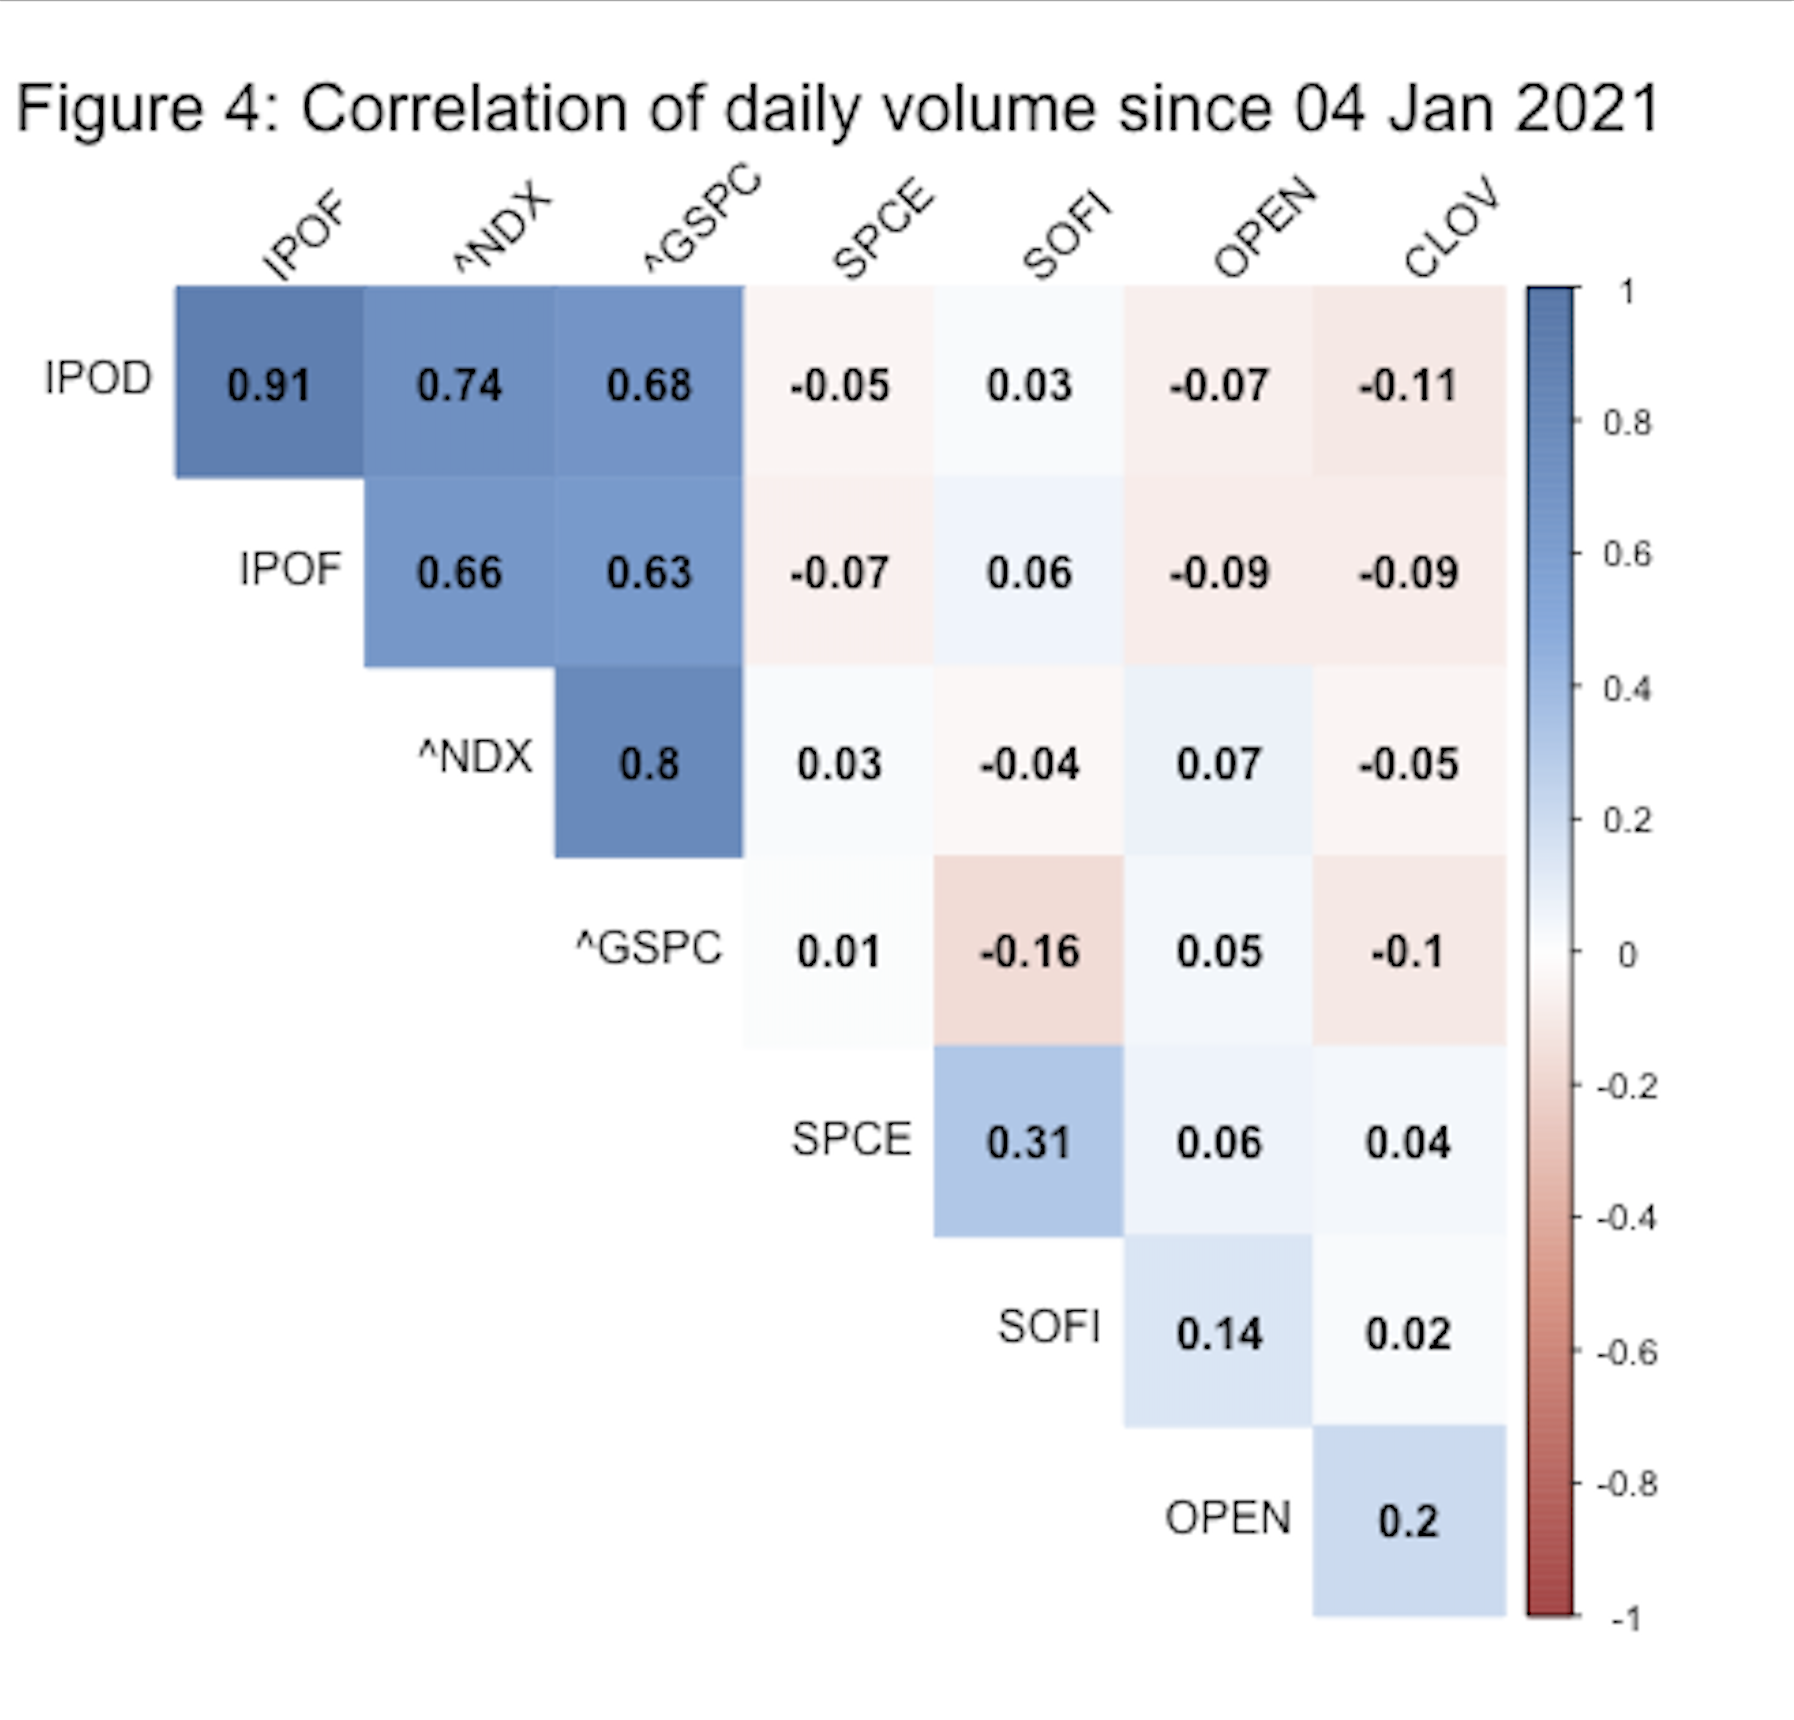
One caveat of applying correlation to price data is the lack of time considerations. As security prices change each day, their correlations change too. A snapshot, single numbered correlation is likely to be biased by the distribution of data points and the subsequent local regression line fitted. A time-rolling correlation would be more appropriate, and is shown in the coming analysis. Nevertheless, the data from Fig. 2 to 4 suggest Chamath’s SPACs have their unique behaviours that seem to deviate from the general market.
Performance analysis: Chamath SPACs returns reveal some concerning risk
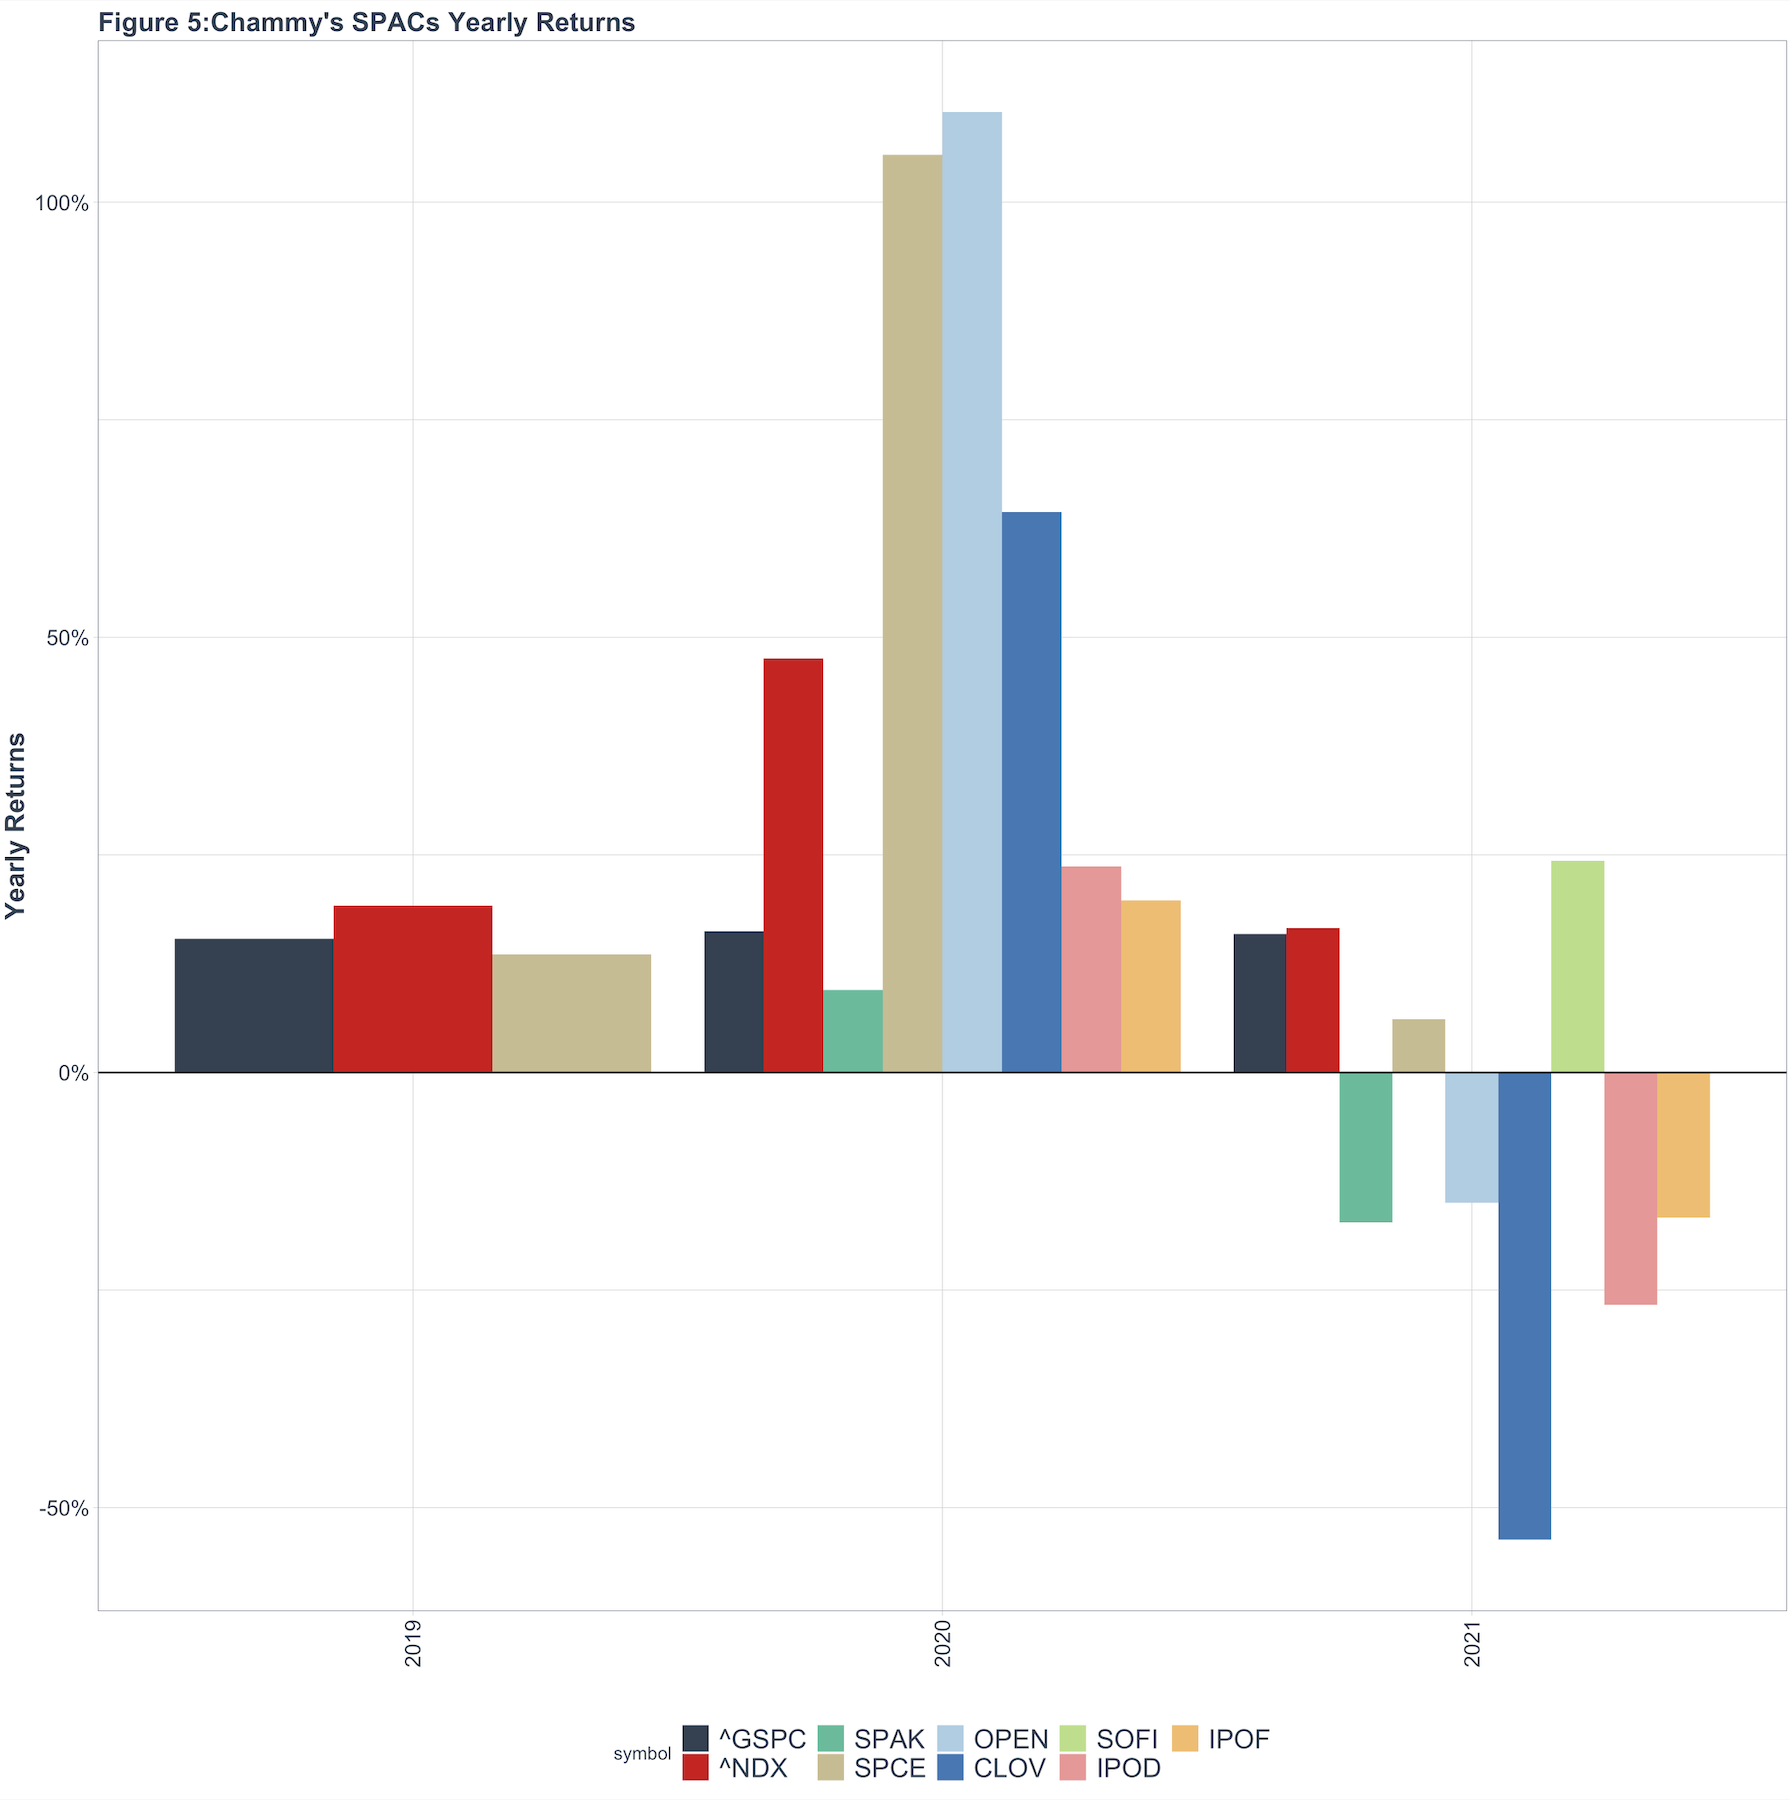
An important performance criteria for any financial instrument is the calculation of percent returns, a metric that Chamath used in his 2020 letter like many others have done before him. Annual returns of Chamath’s SPACs are plotted in the bar graph in Fig. 5 together with the market benchmark S&P 500 (^GSPC in Black) and Nasdaq 100 (^NDX in Red) for the past 3 years. As the scope of this report is about SPACs, a SPAC ETF SPAK(Defiance Next Gen SPAC Derived ETF in Green) is added in the comparison to gauge the performance of Chamath’s SPACs. SPCE was on par with the general market performance in 2019, but exploded in 2020, beating benchmarks and SPAK, together with its SPAC siblings CLOV and OPEN. The numbers calculated are consistent with Chamath’s 2020 letter. However, things took quite a dramatic turn in 2021 with most of Chamath’s SPACs downing when the S&P 500 reached record highs. SOFI is the only one bucking that trend and is probably enjoying the new listing momentum.
The dramatic change in yearly returns might be due to a stint of bad luck or could be due to a string of under performance. Fig. 6 compares monthly returns by aforementioned assets. Benchmarks S&P 500 (^GSPC in Black) and Nasdaq 100 (^NDX in Red) established a pattern of small but steady returns over the past months. SPAK ETF had at the beginning of the year, but more recently is running losses (Fig. 6 top-right chart).
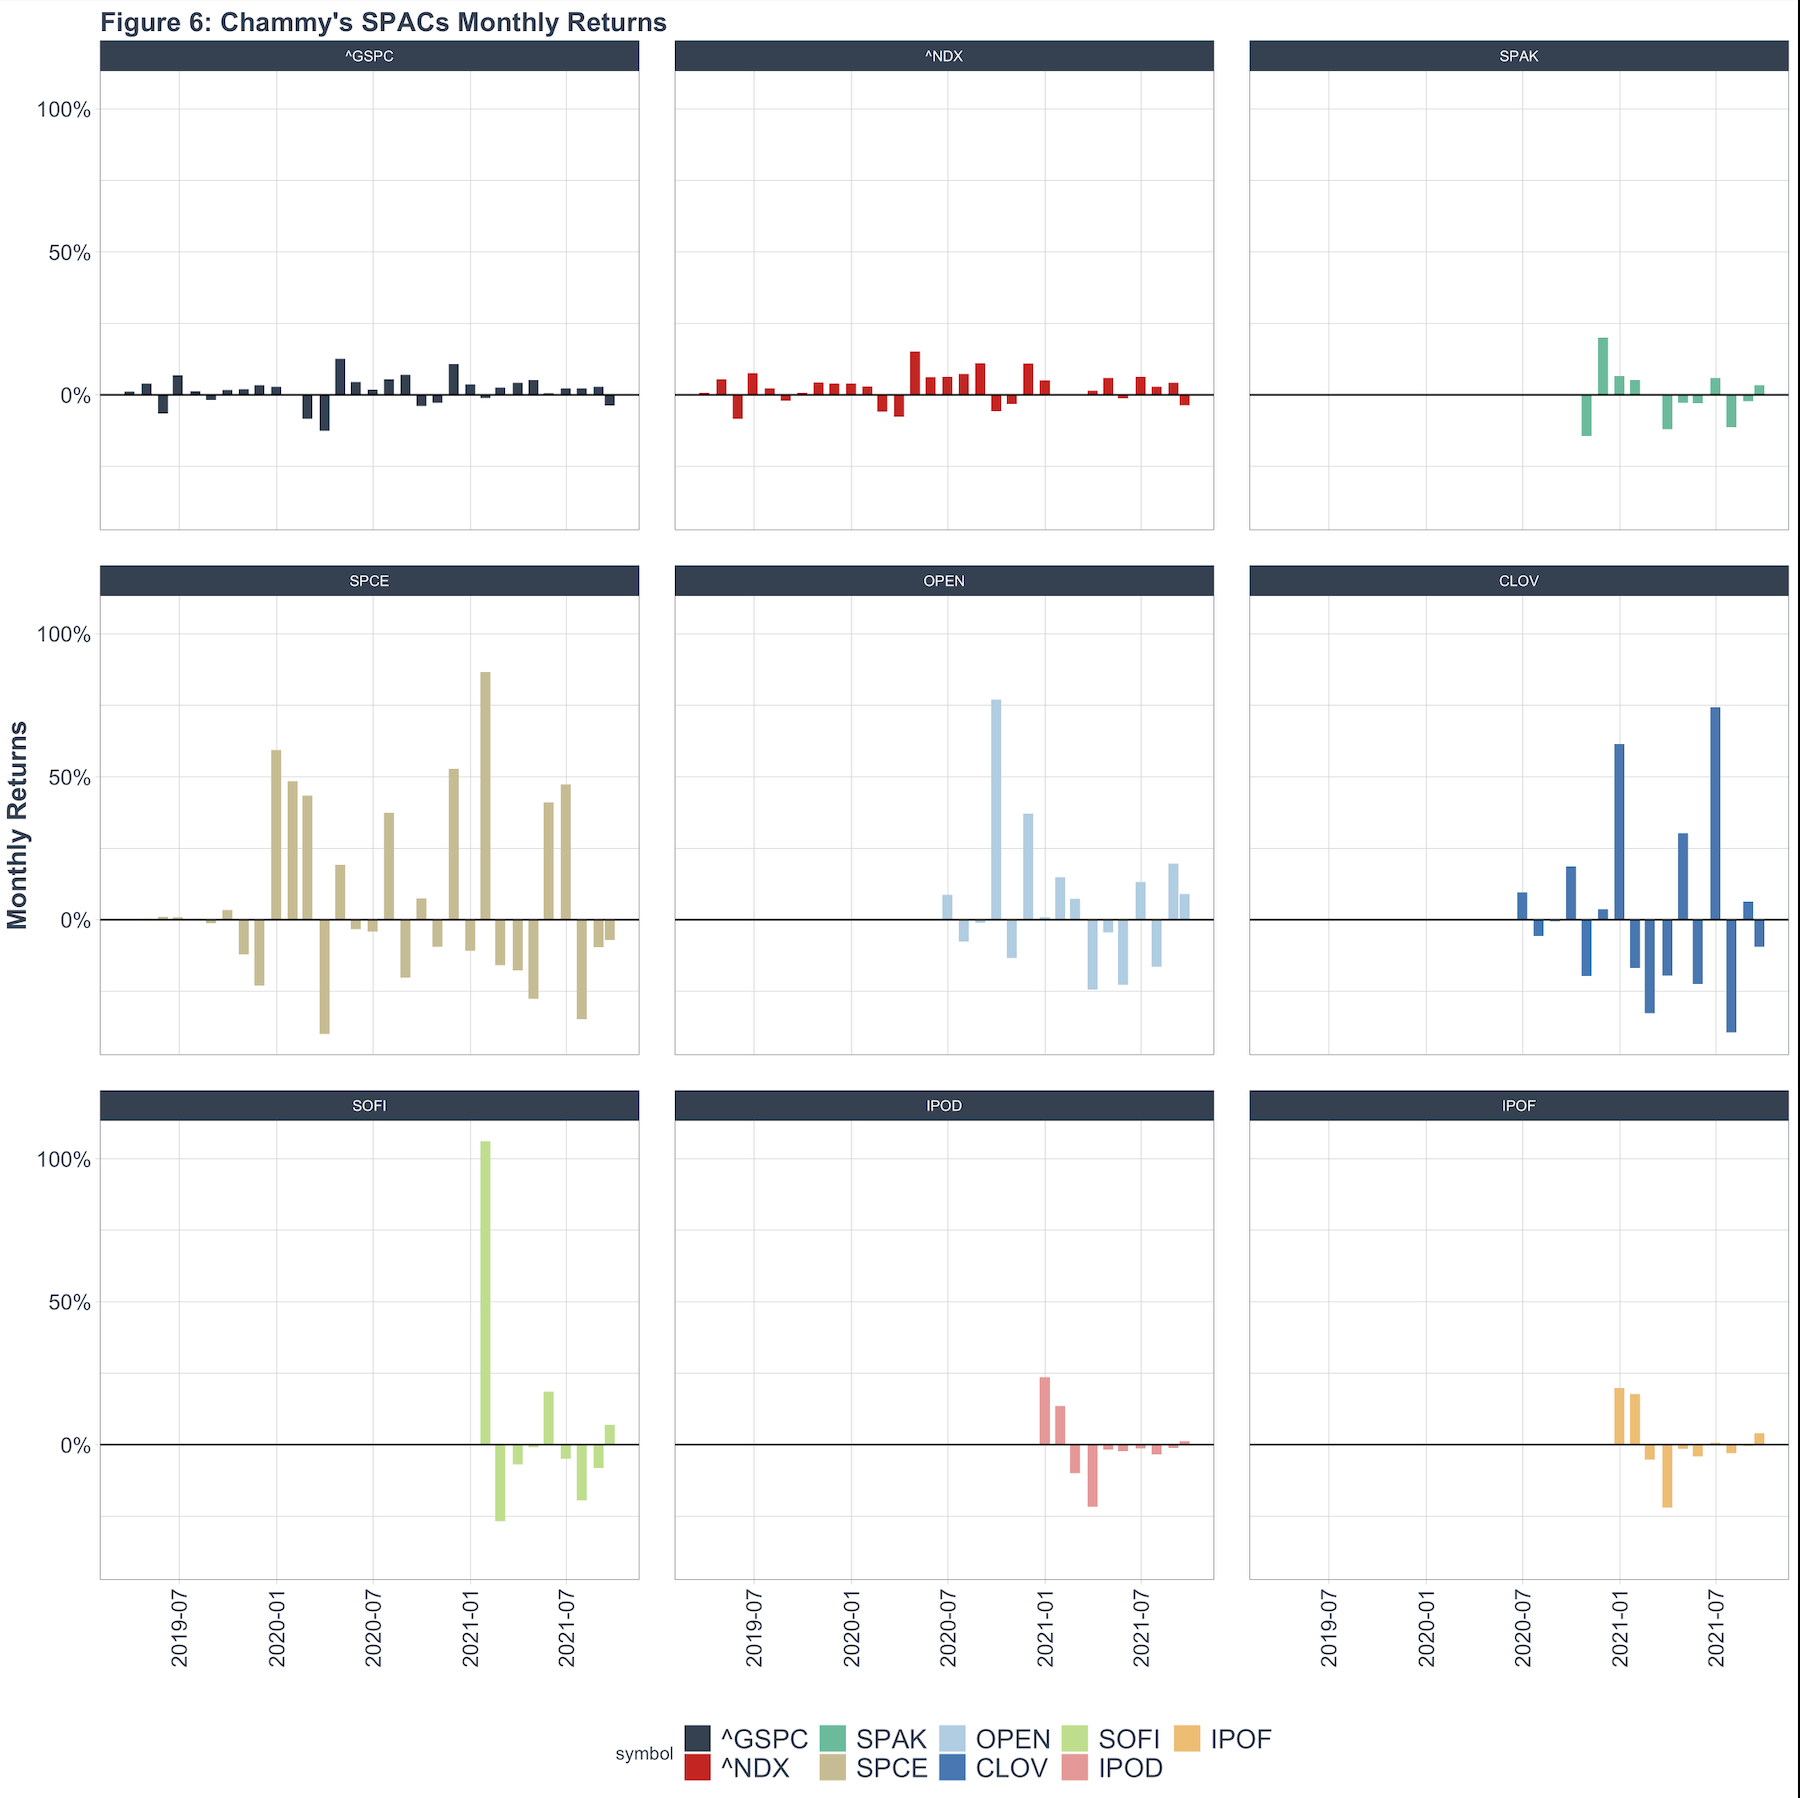
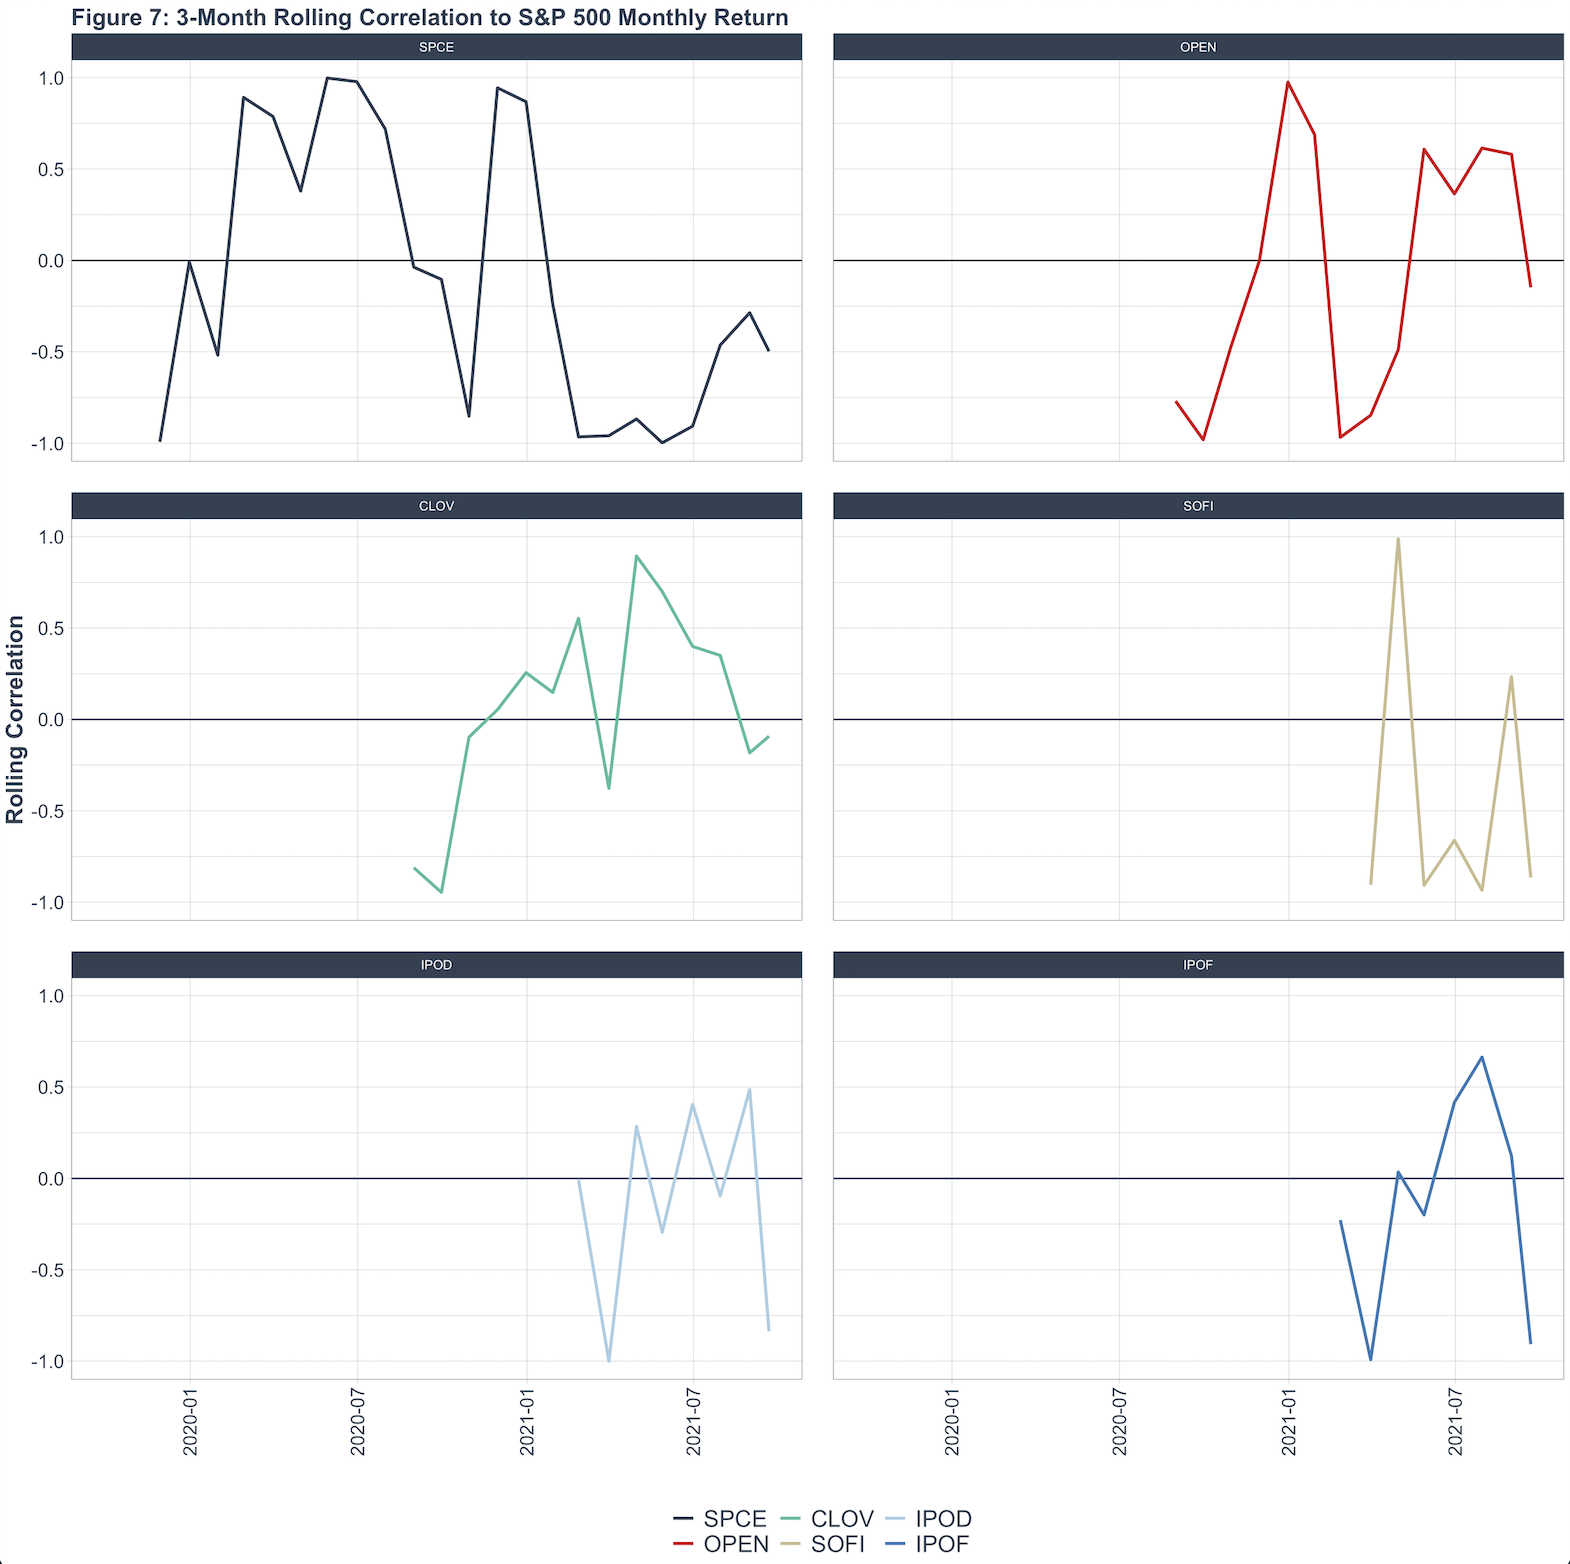
Let’s chat about Chamath’s SPACs. Given the tight correlation discussed before, it is not surprising to see IPOD and IPOF monthly returns mimic each other’s. SOFI, a winner in yearly returns, shows strong signs of a declining trend in returns. Monthly returns for SPCE, OPEN and CLOV are volatile, consistent with its price swings.To quantify this change in monthly returns, a rolling correlation of each Chamath’s SPAC to S&P 500 monthly returns is plotted in Fig. 7 to track this dynamic relationship. One major benefit of a rolling correlation is that we can visualize the change in correlation over time for trend analysis and to pin-point interesting time points when the relationship changes. Apart from matching the S&P 500’s negative performance in early 2021, all of Chamath’s SPACs ended up diverging from general market trends and even became negatively correlated to market returns.
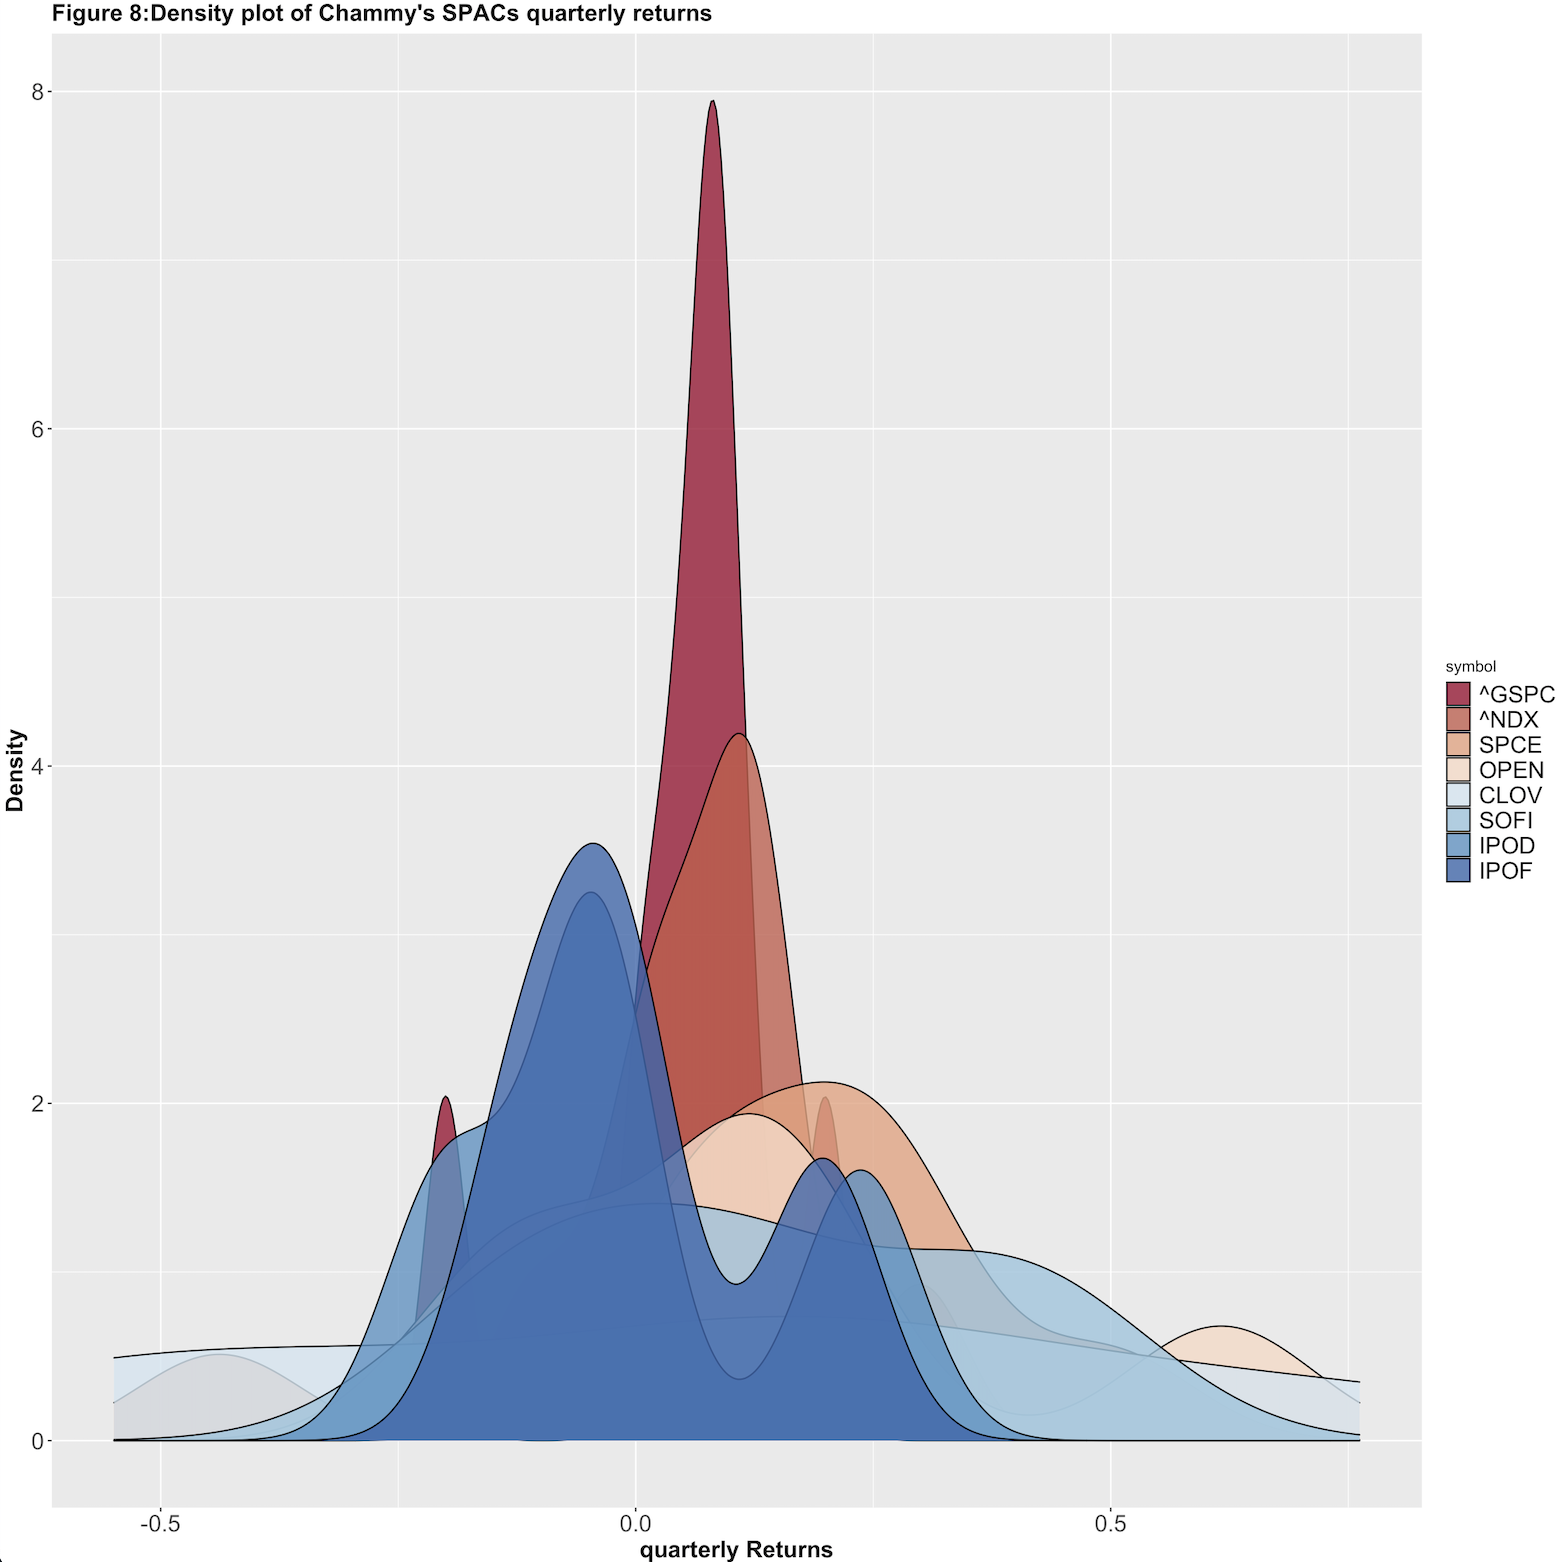
Given the negative trending return on Chamath’s SPACs and their volatile behaviour in price history, it will be useful for investors to consider the risk of owning his SPACs. Risk, usually measured by the extent of volatility in returns, has little to do with how high or low of returns are. To this end, a density plot is constructed in Fig. 8 using the quarterly returns of Chamath’s SPACs and market index for the last 2 years when available. In this way, investors can have a direct view of the mean returns and the extent of volatility of such returns (the spread of the distribution). Consistent with observed volatility patterns, the S&P 500 and Nasdaq 100 have the tightest distributions while Chamath’s SPACs have much longer asymmetric tails, and non-normal distribution. Given distribution violates the assumption of Sharpe ratios, Sharpe ratios of Chamath’s SPACs are not deemed accurate for risk measurement.
Performance analysis: Chamath’s individual SPACs out performed each sector in 2020 but not 2021
To rule out the possibility of sector-specific underperformance due to the COVID-19 pandemic, Fig. 9 compares Chamath’s SPACs to their respective sector ETFs: SPCE to XAR, OPEN to XLRE, CLOV to XLV and SOFI to XLF.
Figure 9: Chamath’s individual SPACs compared to their respective sectors
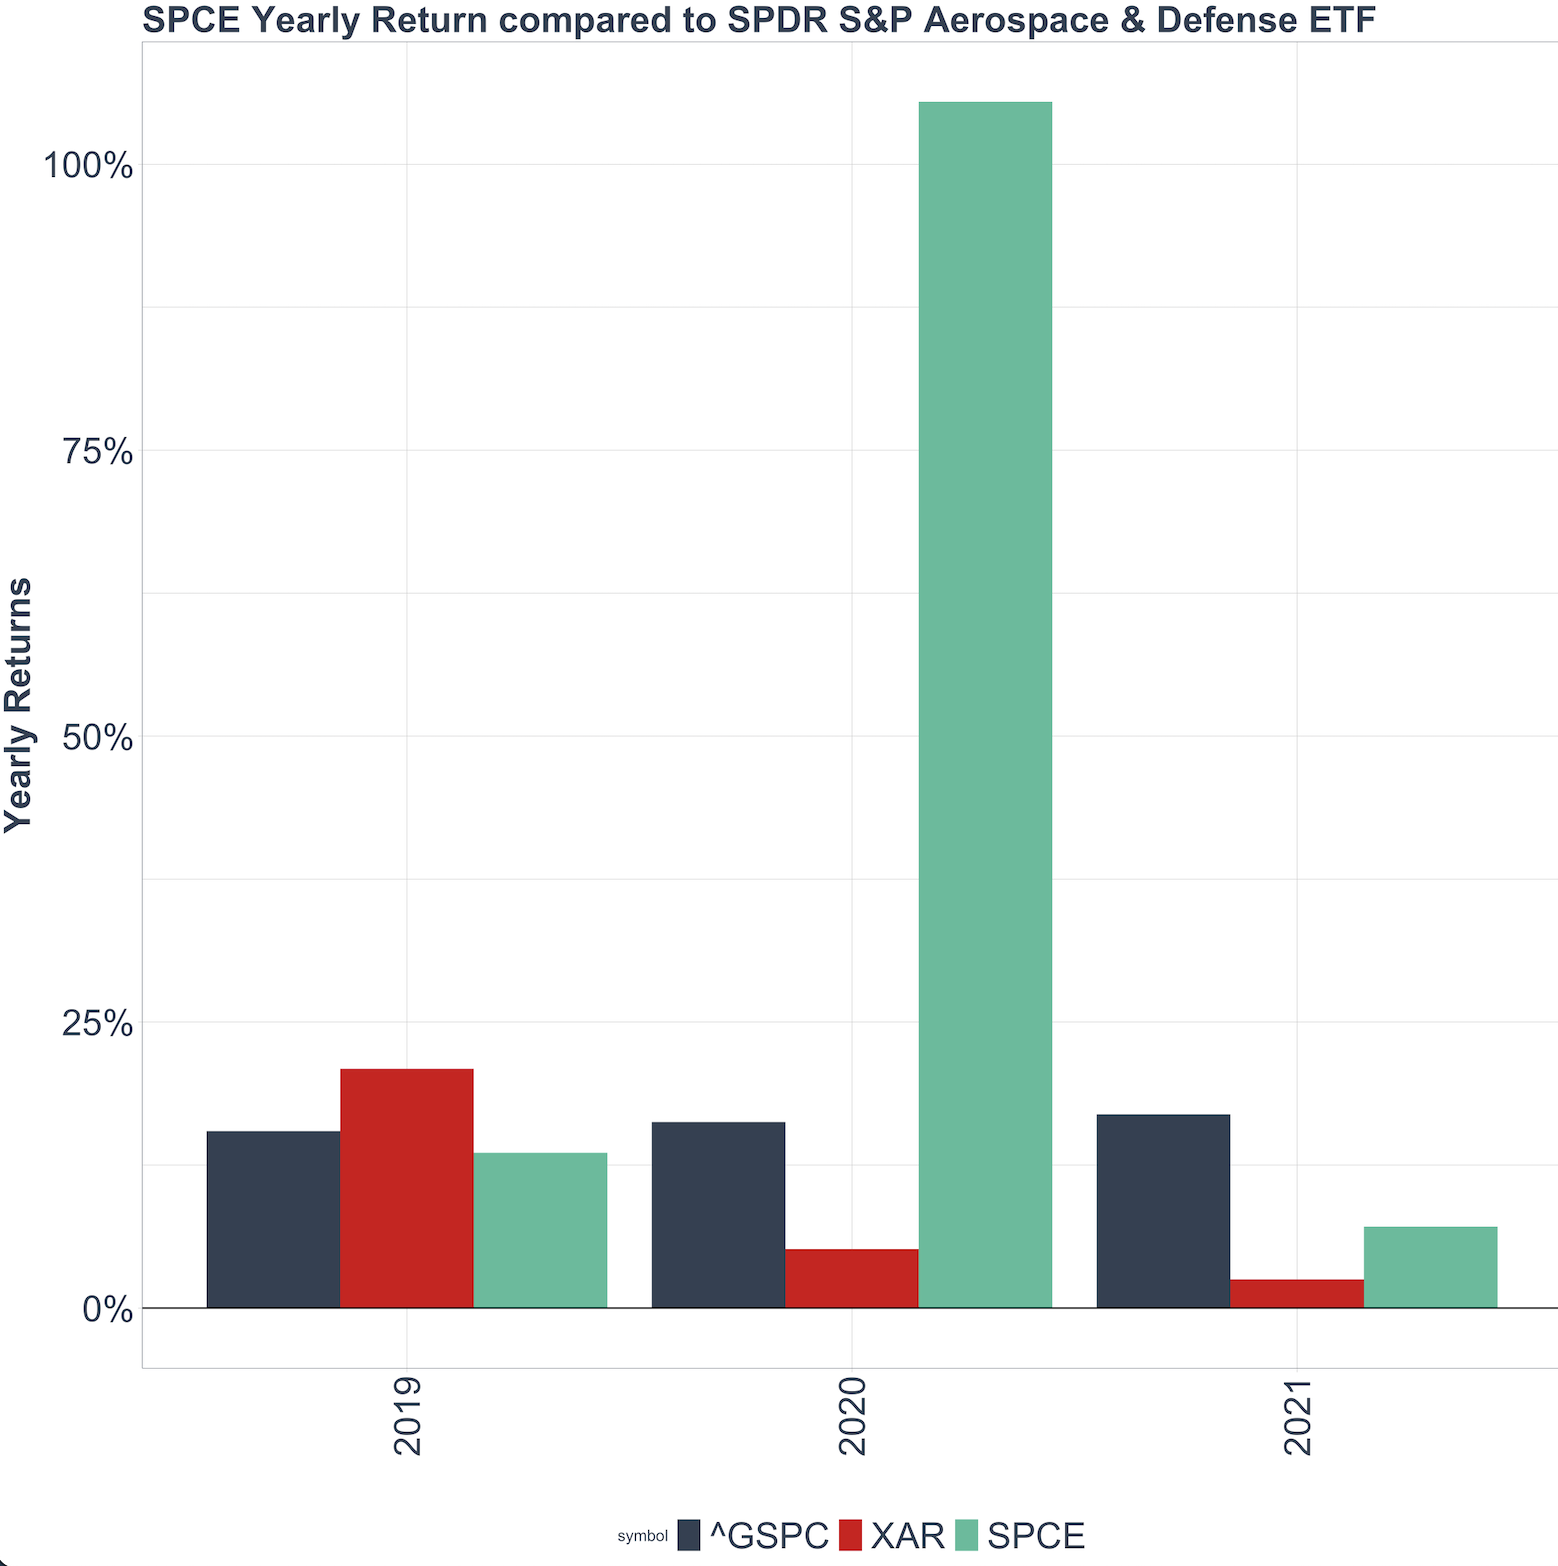
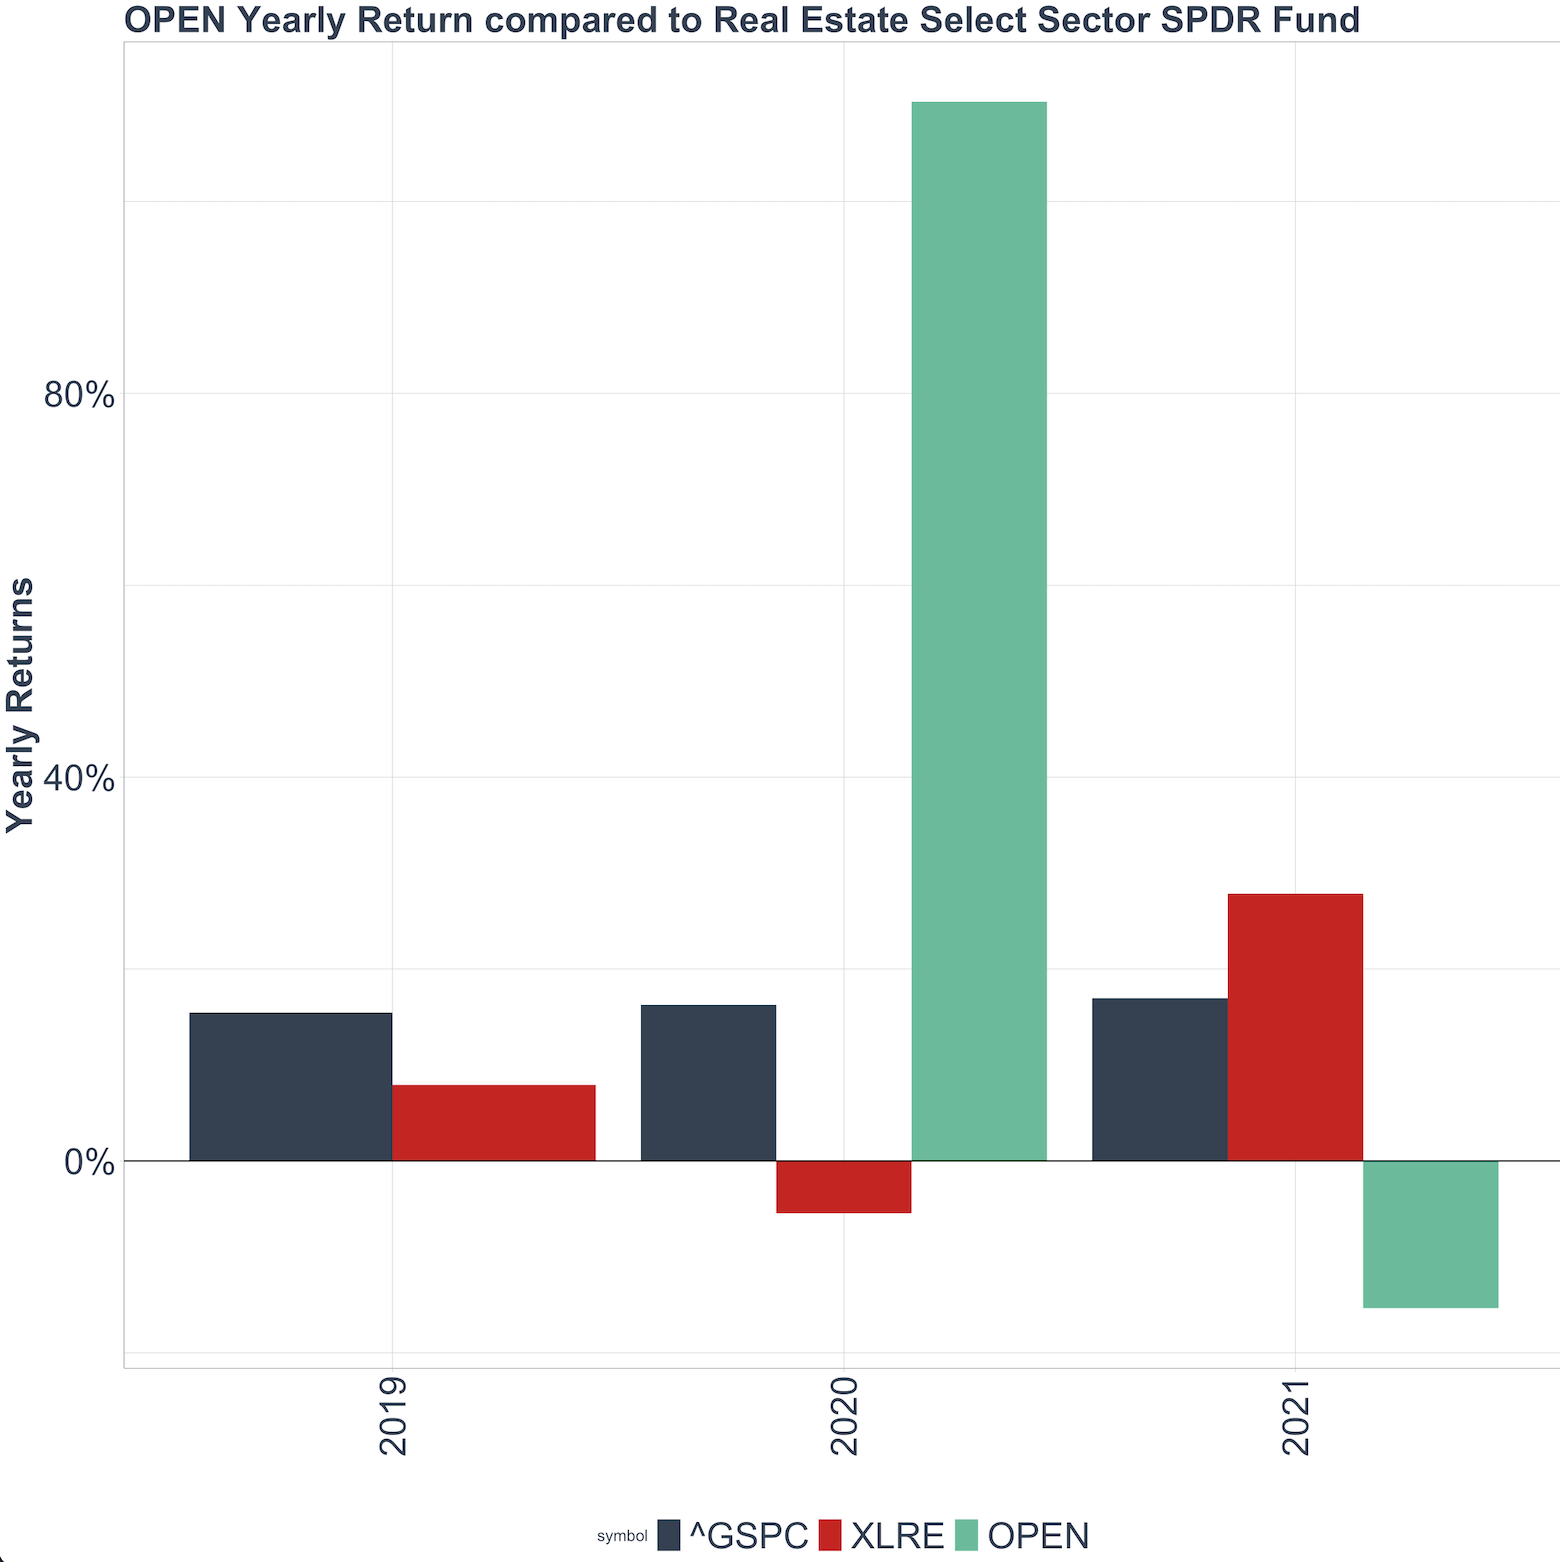
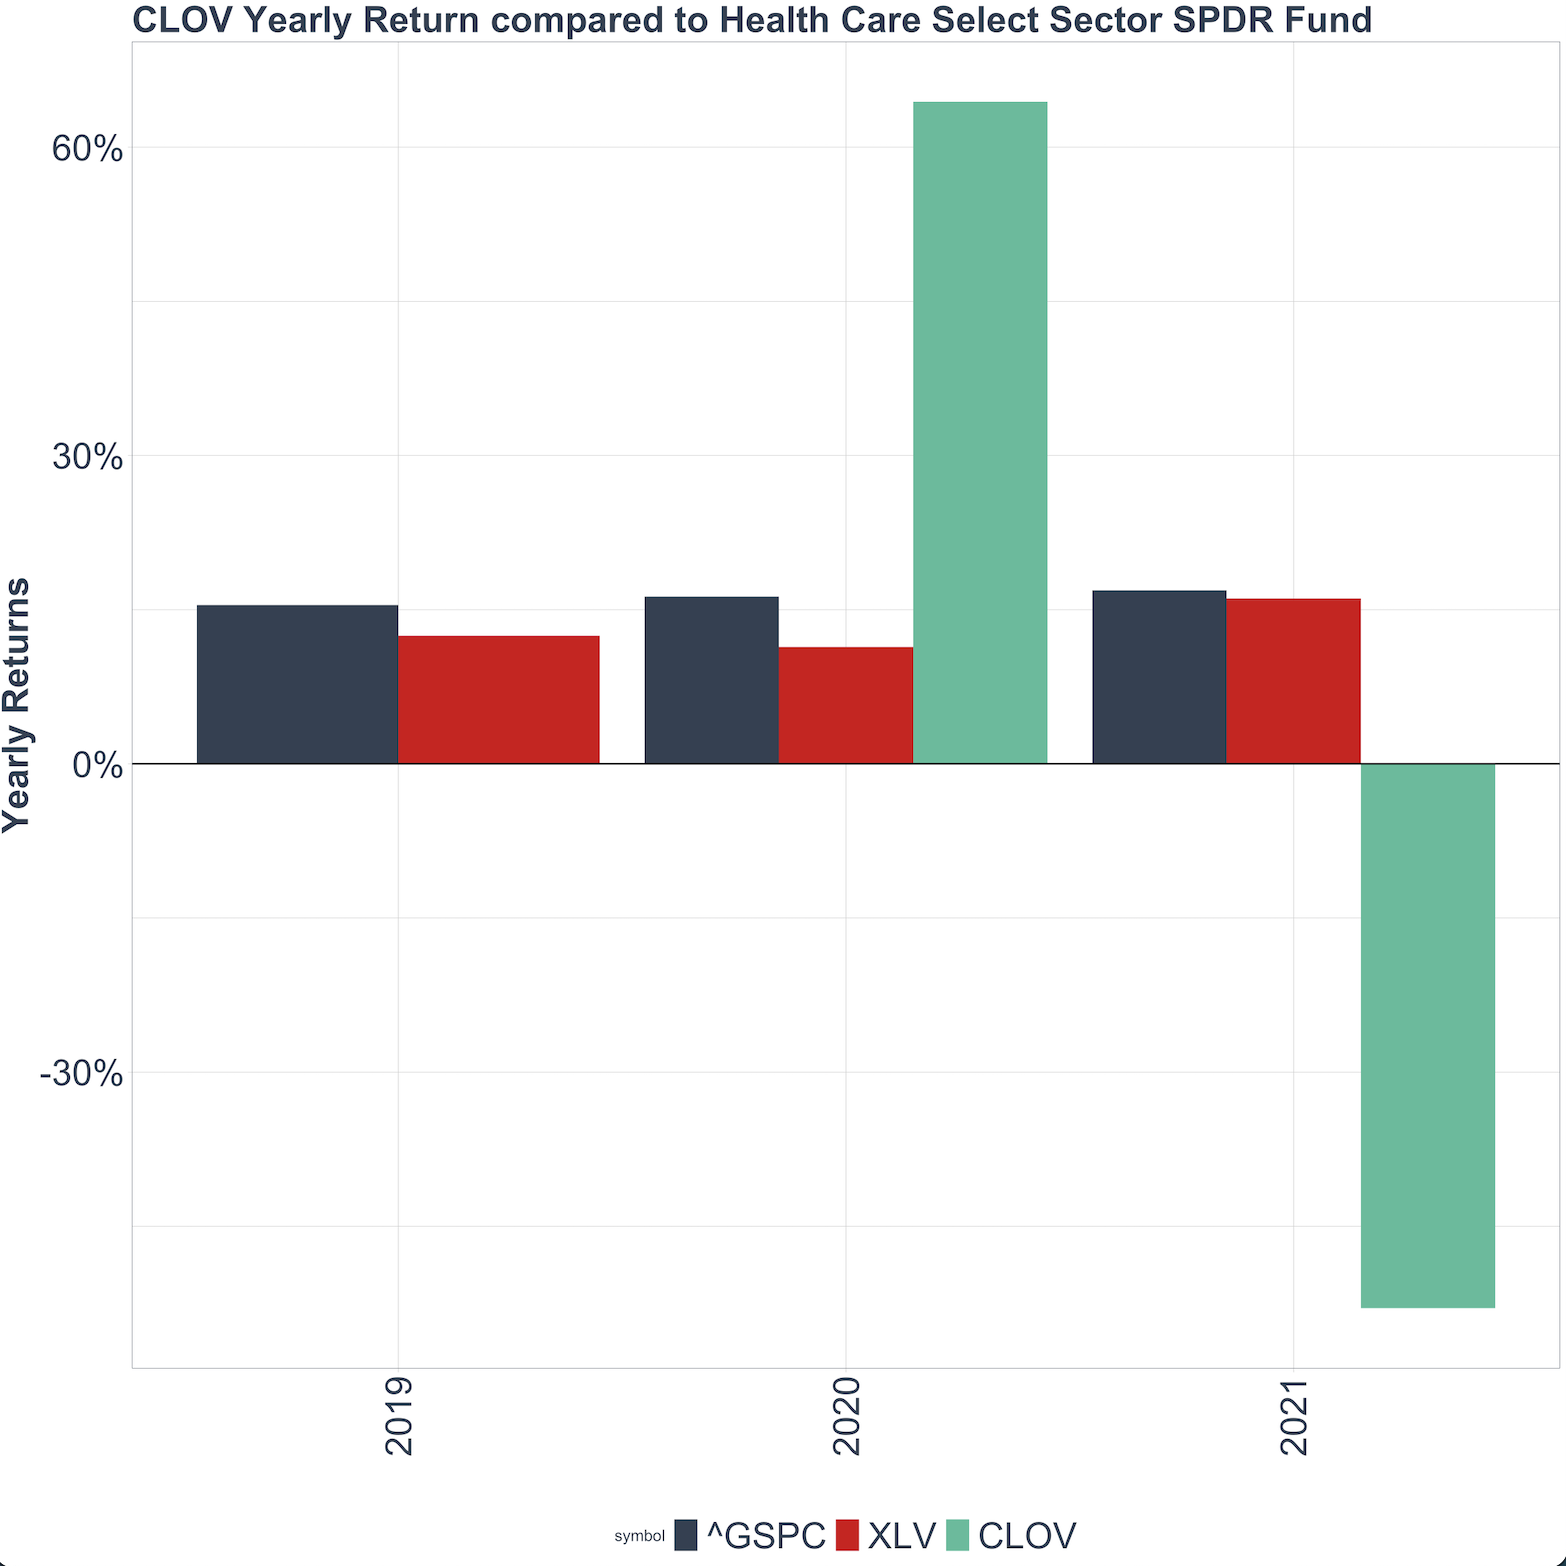
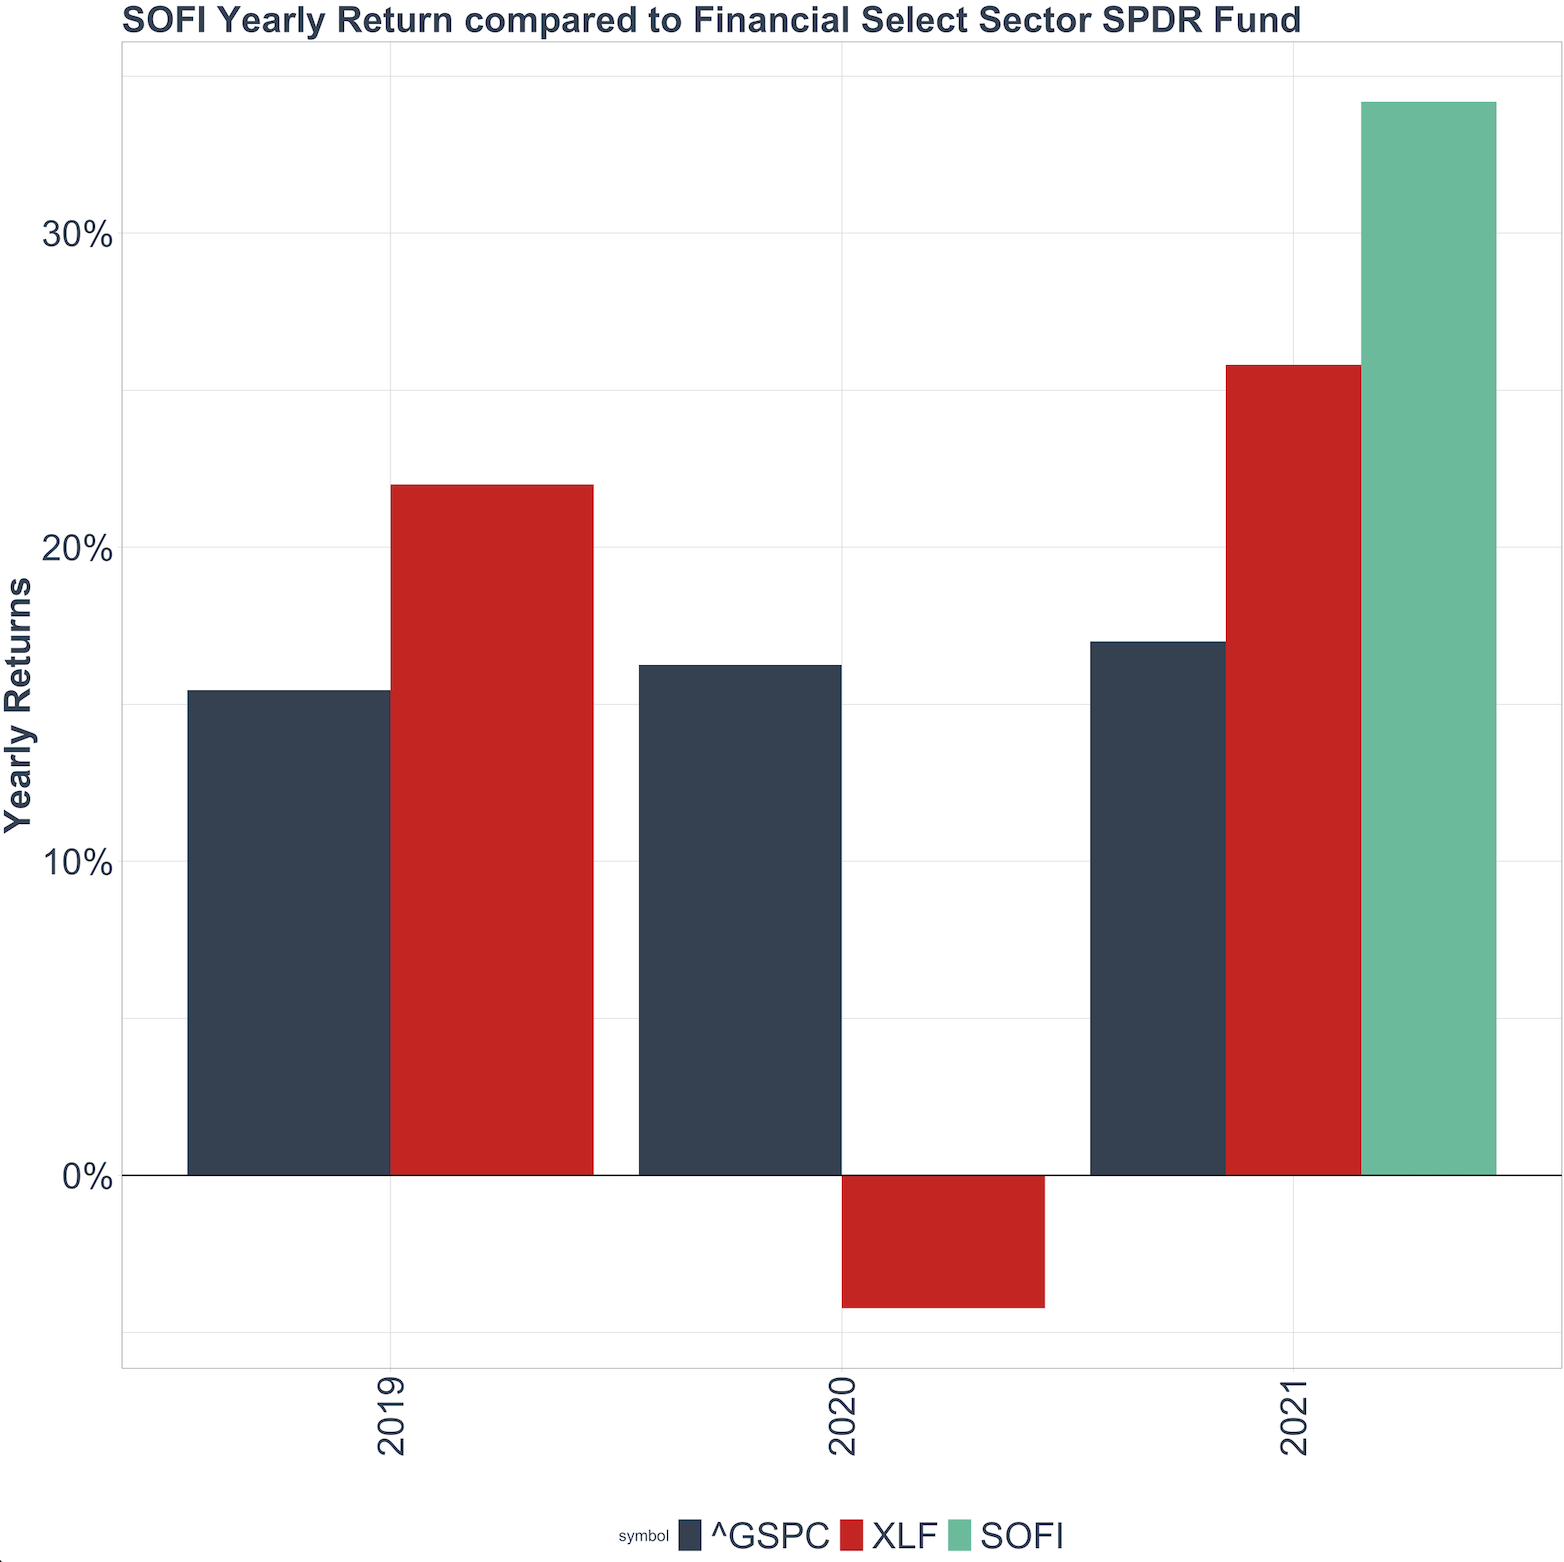
Clearly, each SPAC excelled in their 2020 returns compared to their sector ETFs, with the exception of SOFI (launched in 2021). However, their underperformance in 2021 cannot be explained by sector specific factors.
- Although XAR is lagging the S&P 500 in 2021 and losing momentum from its own 2020 performance, the sharp decrease for SPCE is significantly disproportionate to that of the XAR.
- OPEN is negative while the sector benefits from post-COVID recovery in 2021.
- XLV is on par with S&P 500 and its own past performance, whereas CLOV sinks to -30% in 2021.
- SOFI, as explained above, is likely on track for adjustment
Performance analysis: Chamath’s SPACs are not the best performing SPACs yet they are unique
Since Chamath’s SPACs are volatile and detached from market benchmarks and sector averages, let’s compare his SPAC to all other merged SPACs. In Fig.5, returns for SPAK ETF revealed that 2021 was a bad year for more than just Chamath’s SPACs. A list of 188 SPACs that had mergers since 2020 was used to compare annual returns to Chamath’s SPACs. Fig. 10 shows 2020 returns in ascending order, while Fig. 11 shows 2021.
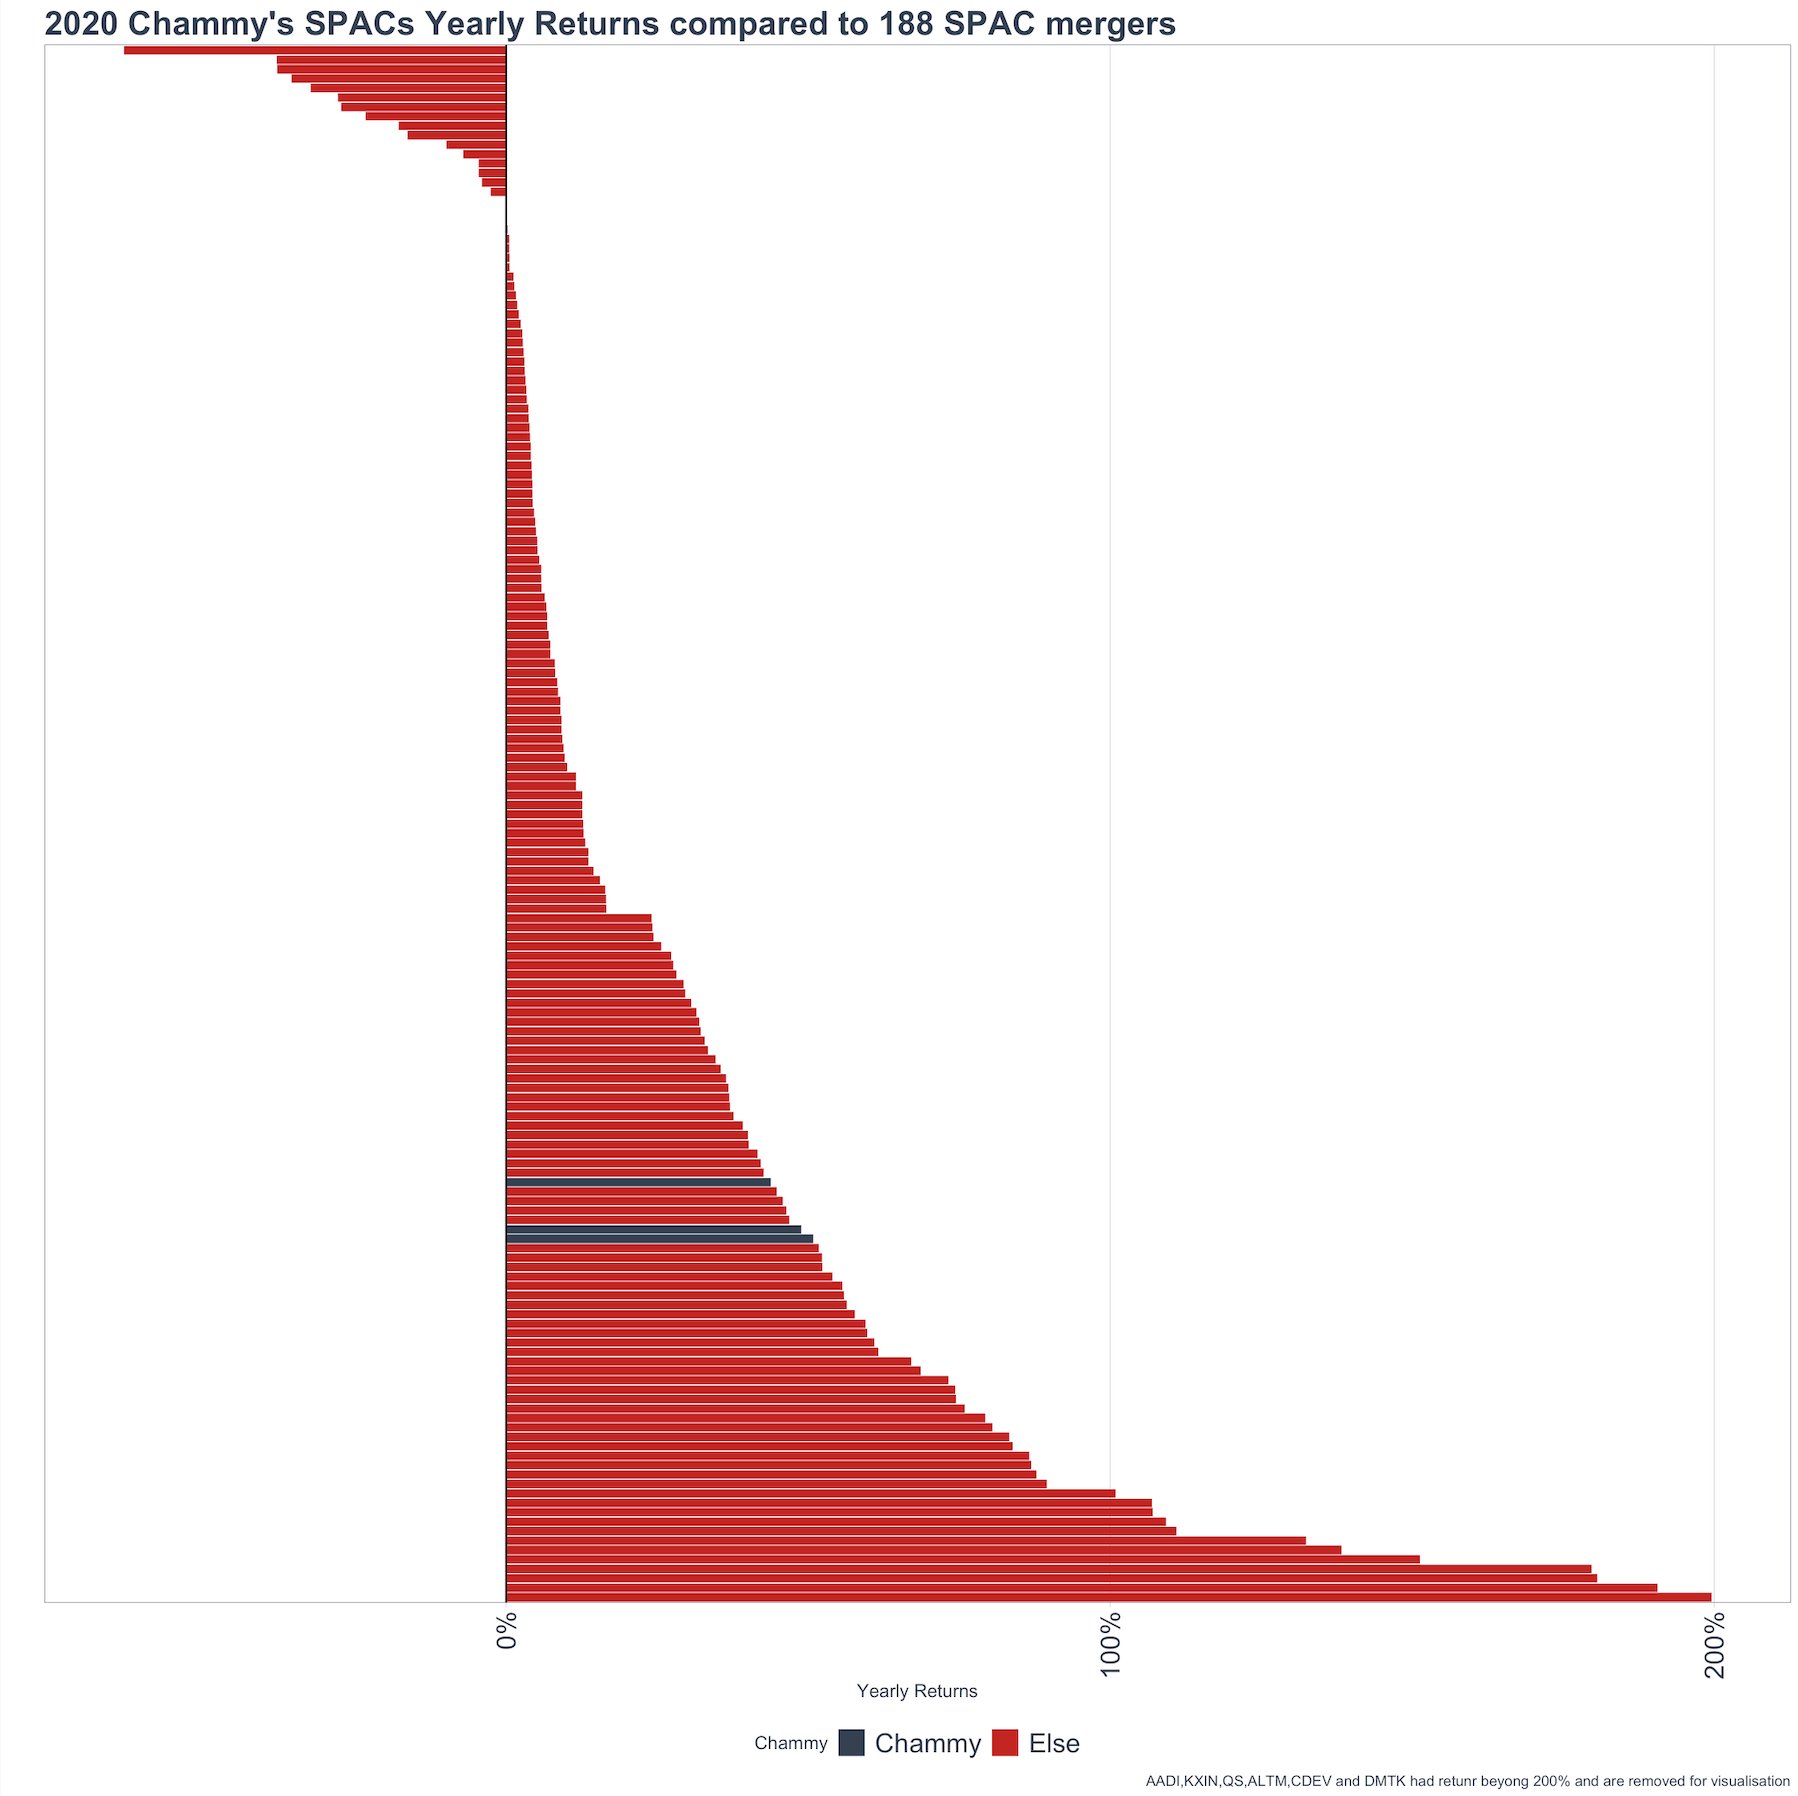
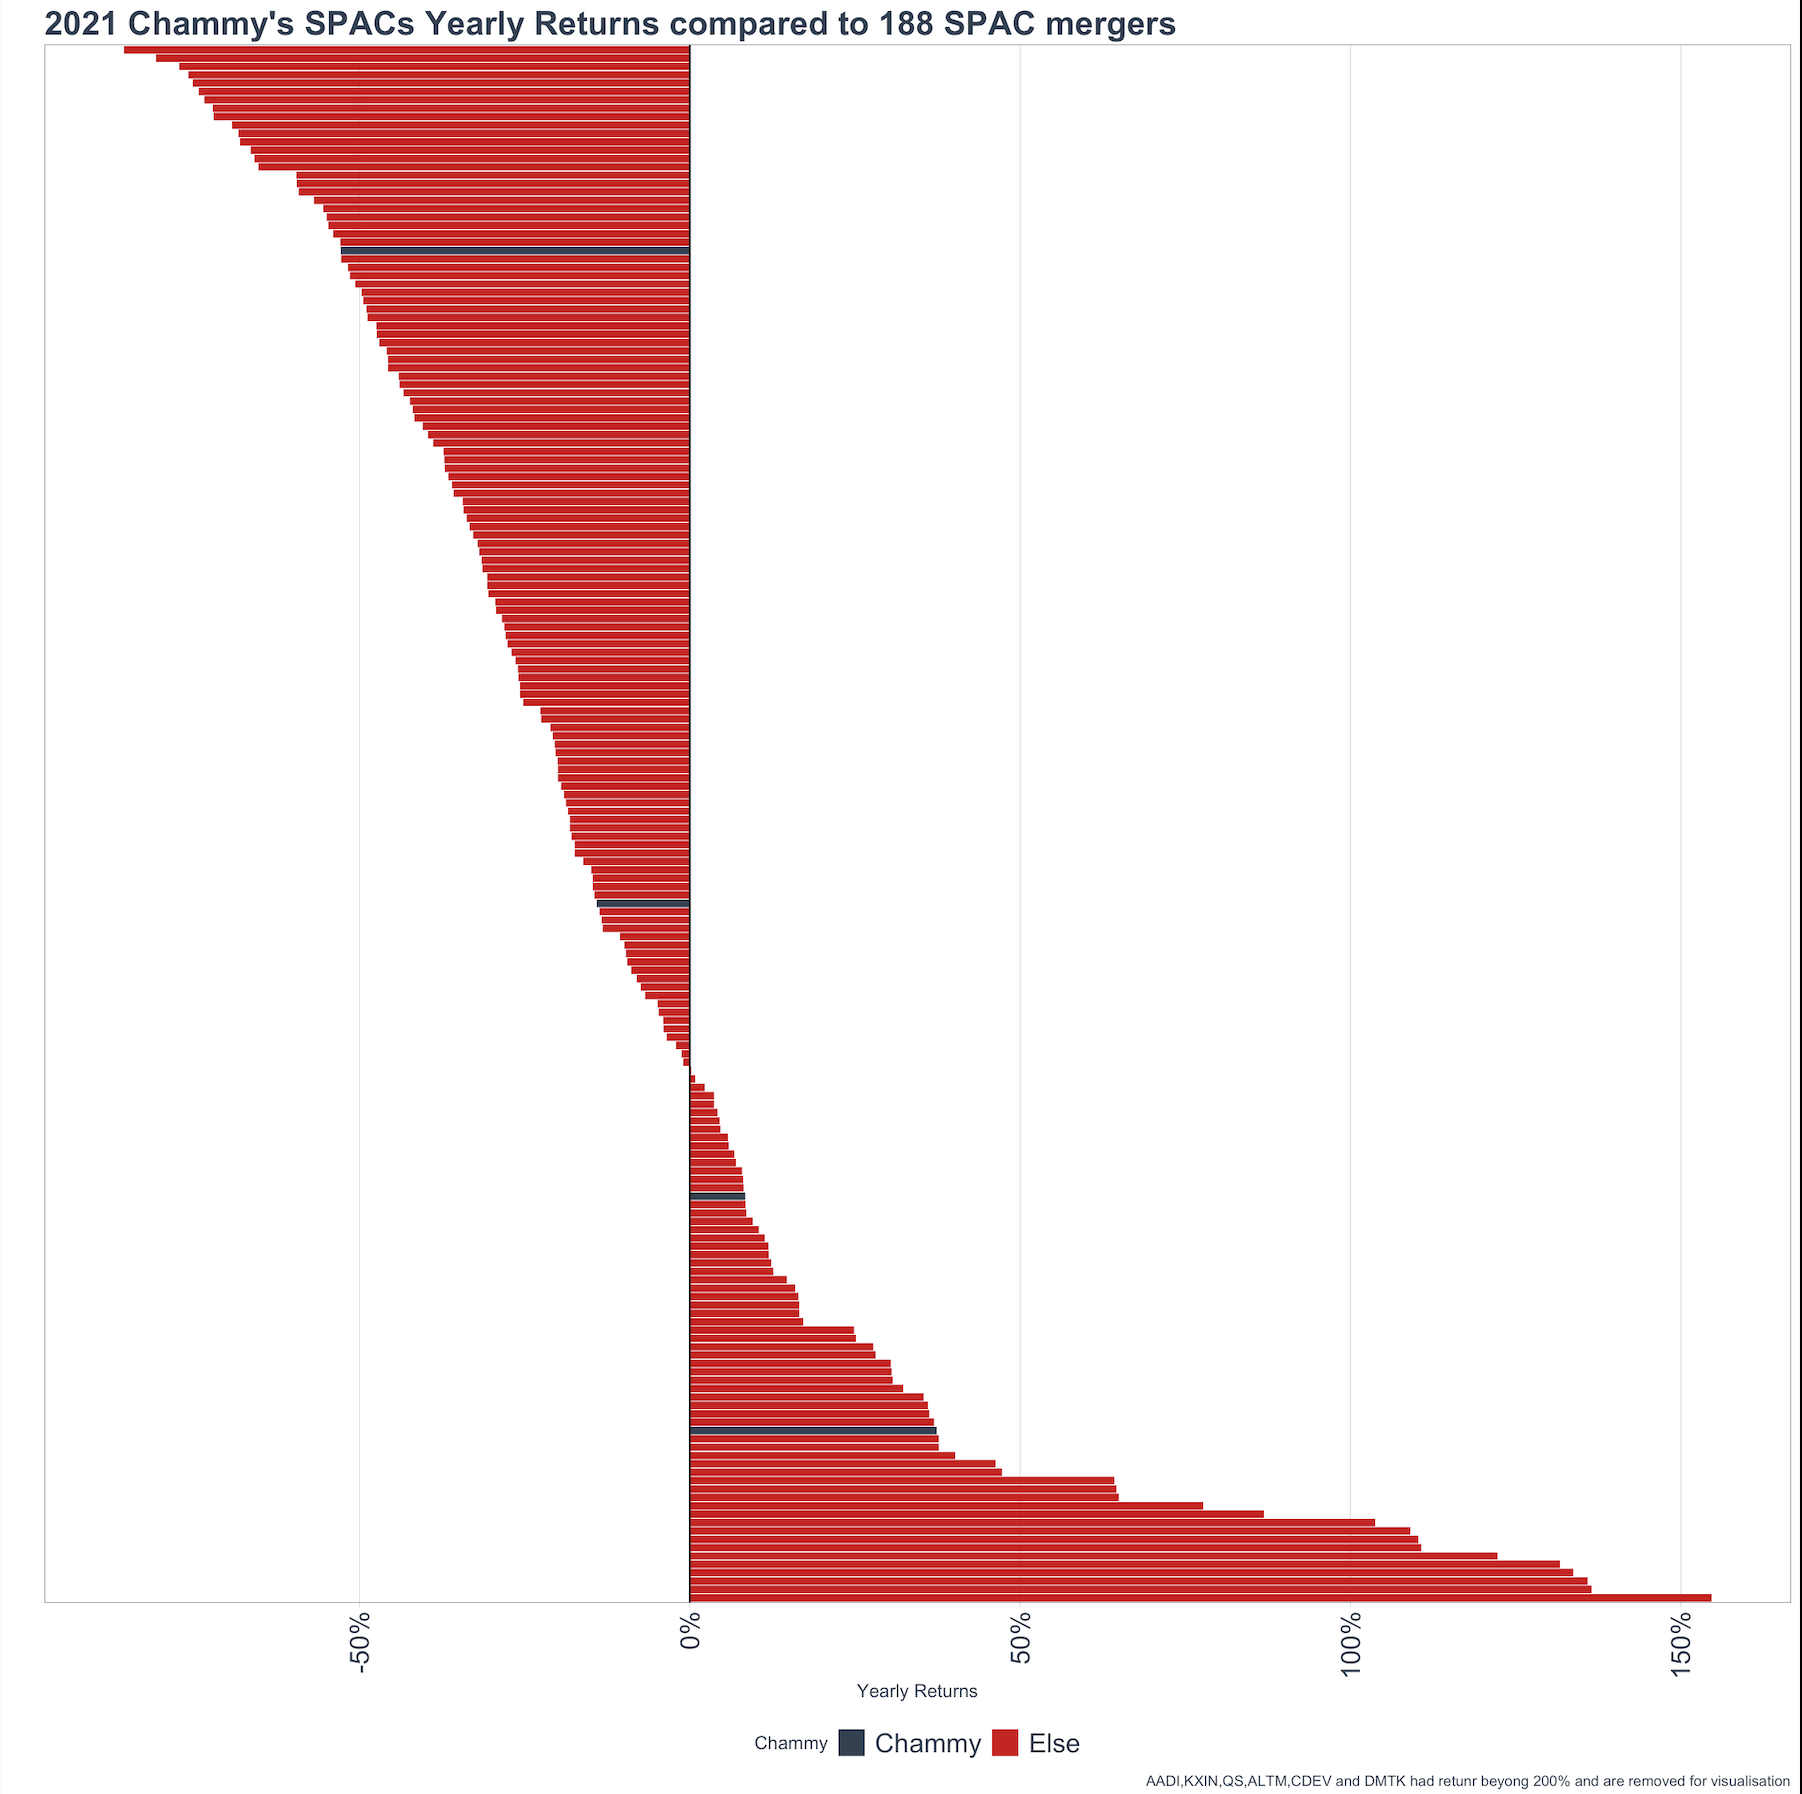
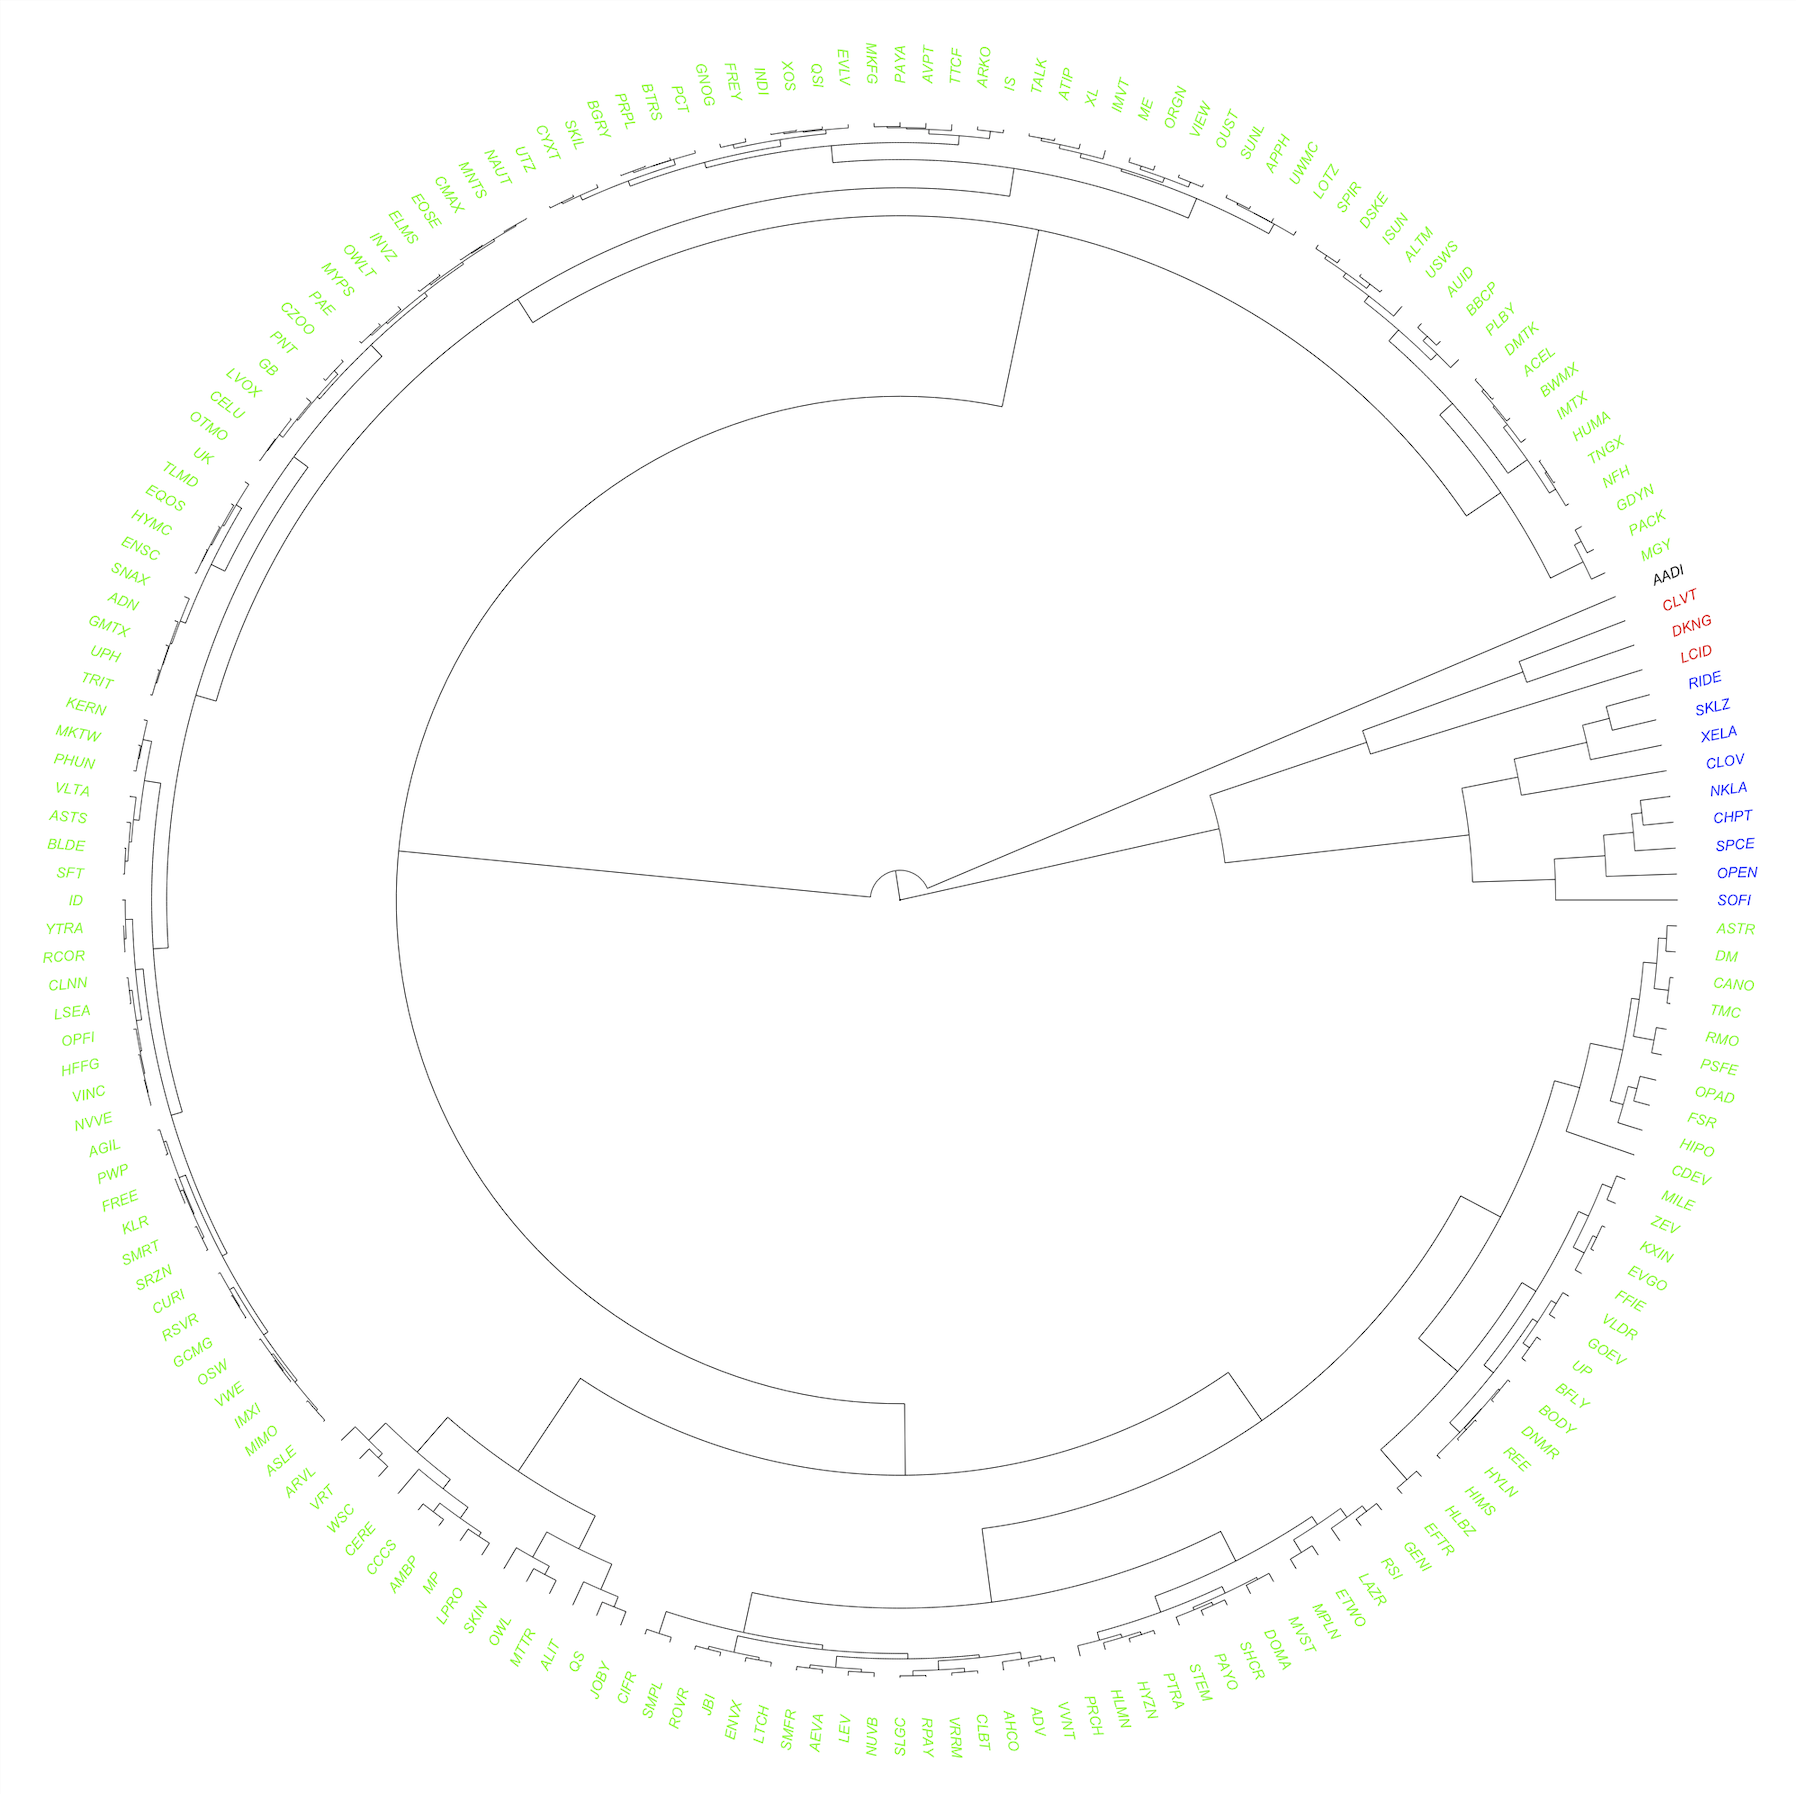
To easily track Chamath’s assets, all other companies’ symbols are hidden and colored red, while Chamath’s SPACs are navy. The data clearly indicates that in 2020, Chamath’s SPACs were doing great, just like most SPACs. However, judging by annual returns alone, his SPACs were far from the best performing ones. In 2021, more than 50% of the SPACs suffered negative returns and Chamath’s only positive performers were SOFI and SPCE. This is especially damaging to Chamath’s “King of SPACs” title when we see that 77% of 2020’s positive returning SPACs remained positive in 2021 (51 out of the 66).SPACs vary in market capitalization and their daily trading volume, therefore annual returns (with only 2 years of data) have limitations in assessing Chamath’s performance. Given that Chamath’s SPACs seem to correlate with each other, an unbiased clustering trial (Fig. 12) was carried out on all 188 SPACs by factoring in their market capitalization, daily trading volume and annual returns to see whether any interesting patterns exist.A hierarchical clustering analysis groupssimilar objects into groups called clusters based on the multiple input variables provided. This approach is an unsupervised way to detect structures within data and free from human presumptions. Hierarchical clustering in addition provides the hierarchical relationship between clusters as shown in the tree-like dendrograms in Fig. 12 so that similarities between clusters can be visualised. Input variables in the test have been scales to prevent bias due to scale. The expected results should be able to tell:
- whether Chamath’s SPACs joins or deviating from other SPACs,
- If Chamath’s SPACs cluster with winners or losers (by return).
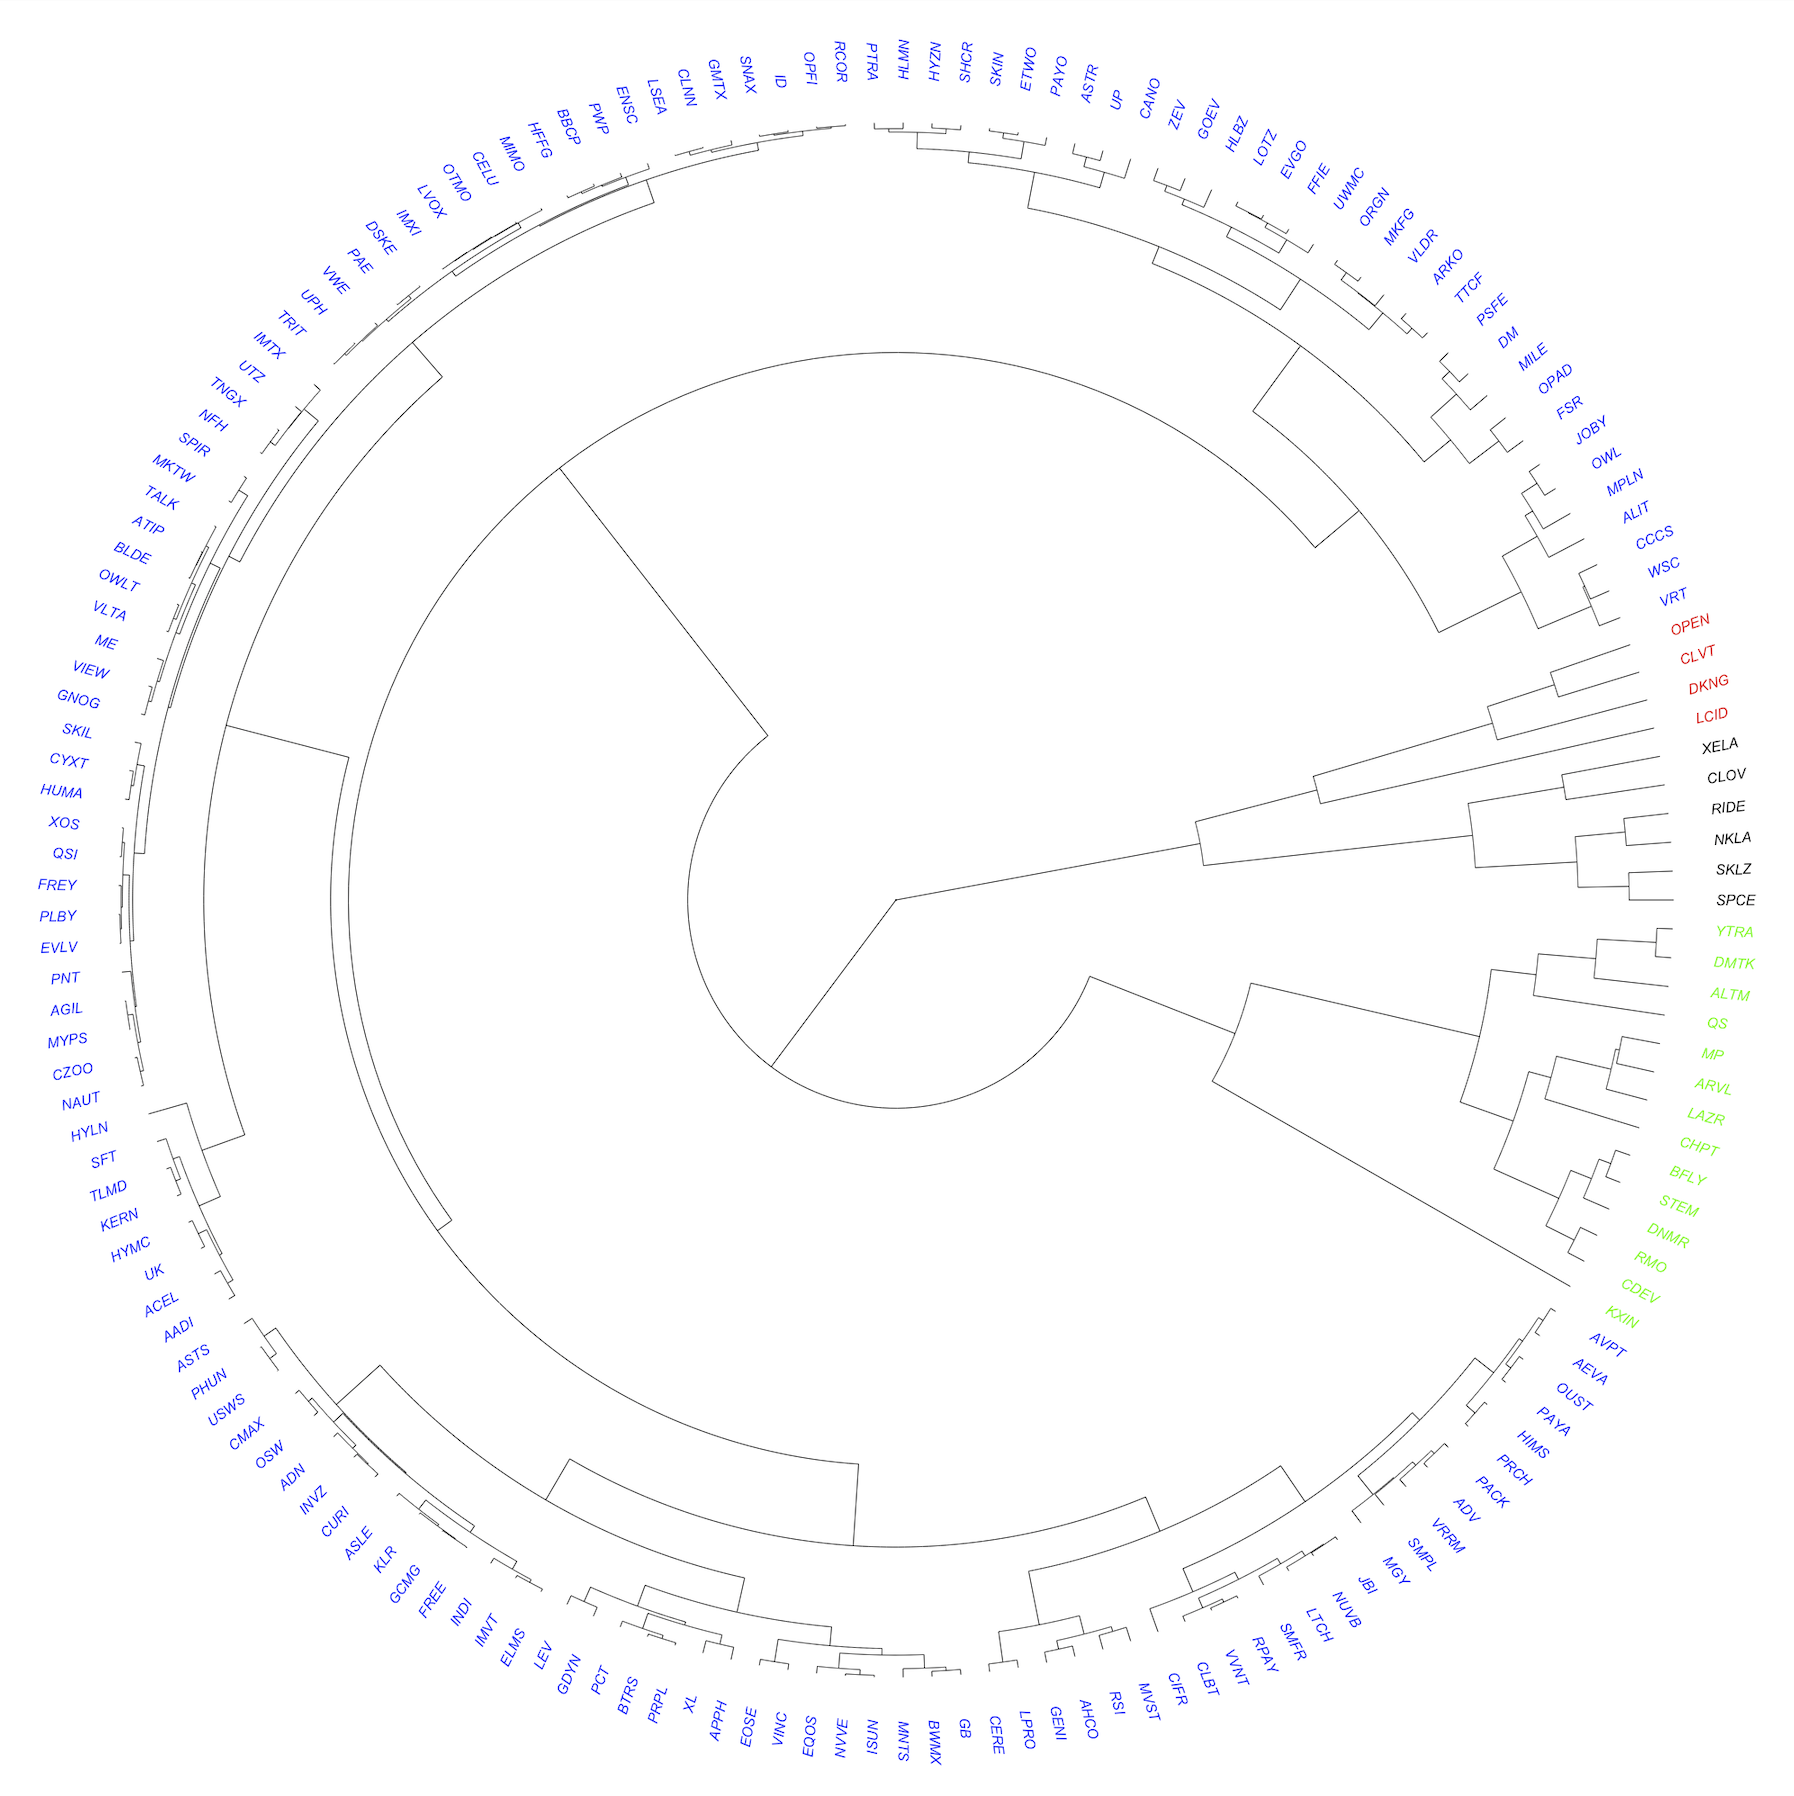
Although the test is limited to the three input variables, Chamath’s assets remained highly distinct compared to other SPACs over the 2 consecutive years as they tend to cluster together. In 2020, the best performing SPACs are mostly found in another cluster where you see symbols like KXIN, QS, ALTM, DMTK, LAZR (Green) but Chamath’s SPACs fell outside this cluster. Of note, Chamath’s PIPE deal MP is in the top performer cluster. In 2021, Chamath’s SPACs are even more similar (Blue) and they do not join the clear winner clusters (AADI in Black, or LCID in Red).At the same time, Chammy’s SPACs stay far away from border Green cluster that contains loser (LAZR) and near zero return clusters (NFH). This really suggests Chamath’s SPACs have some unique properties.
Figure 12: Hierarchical clustering on 188 SPACs in 2020 (top chart) and 2021 (bottom chart)
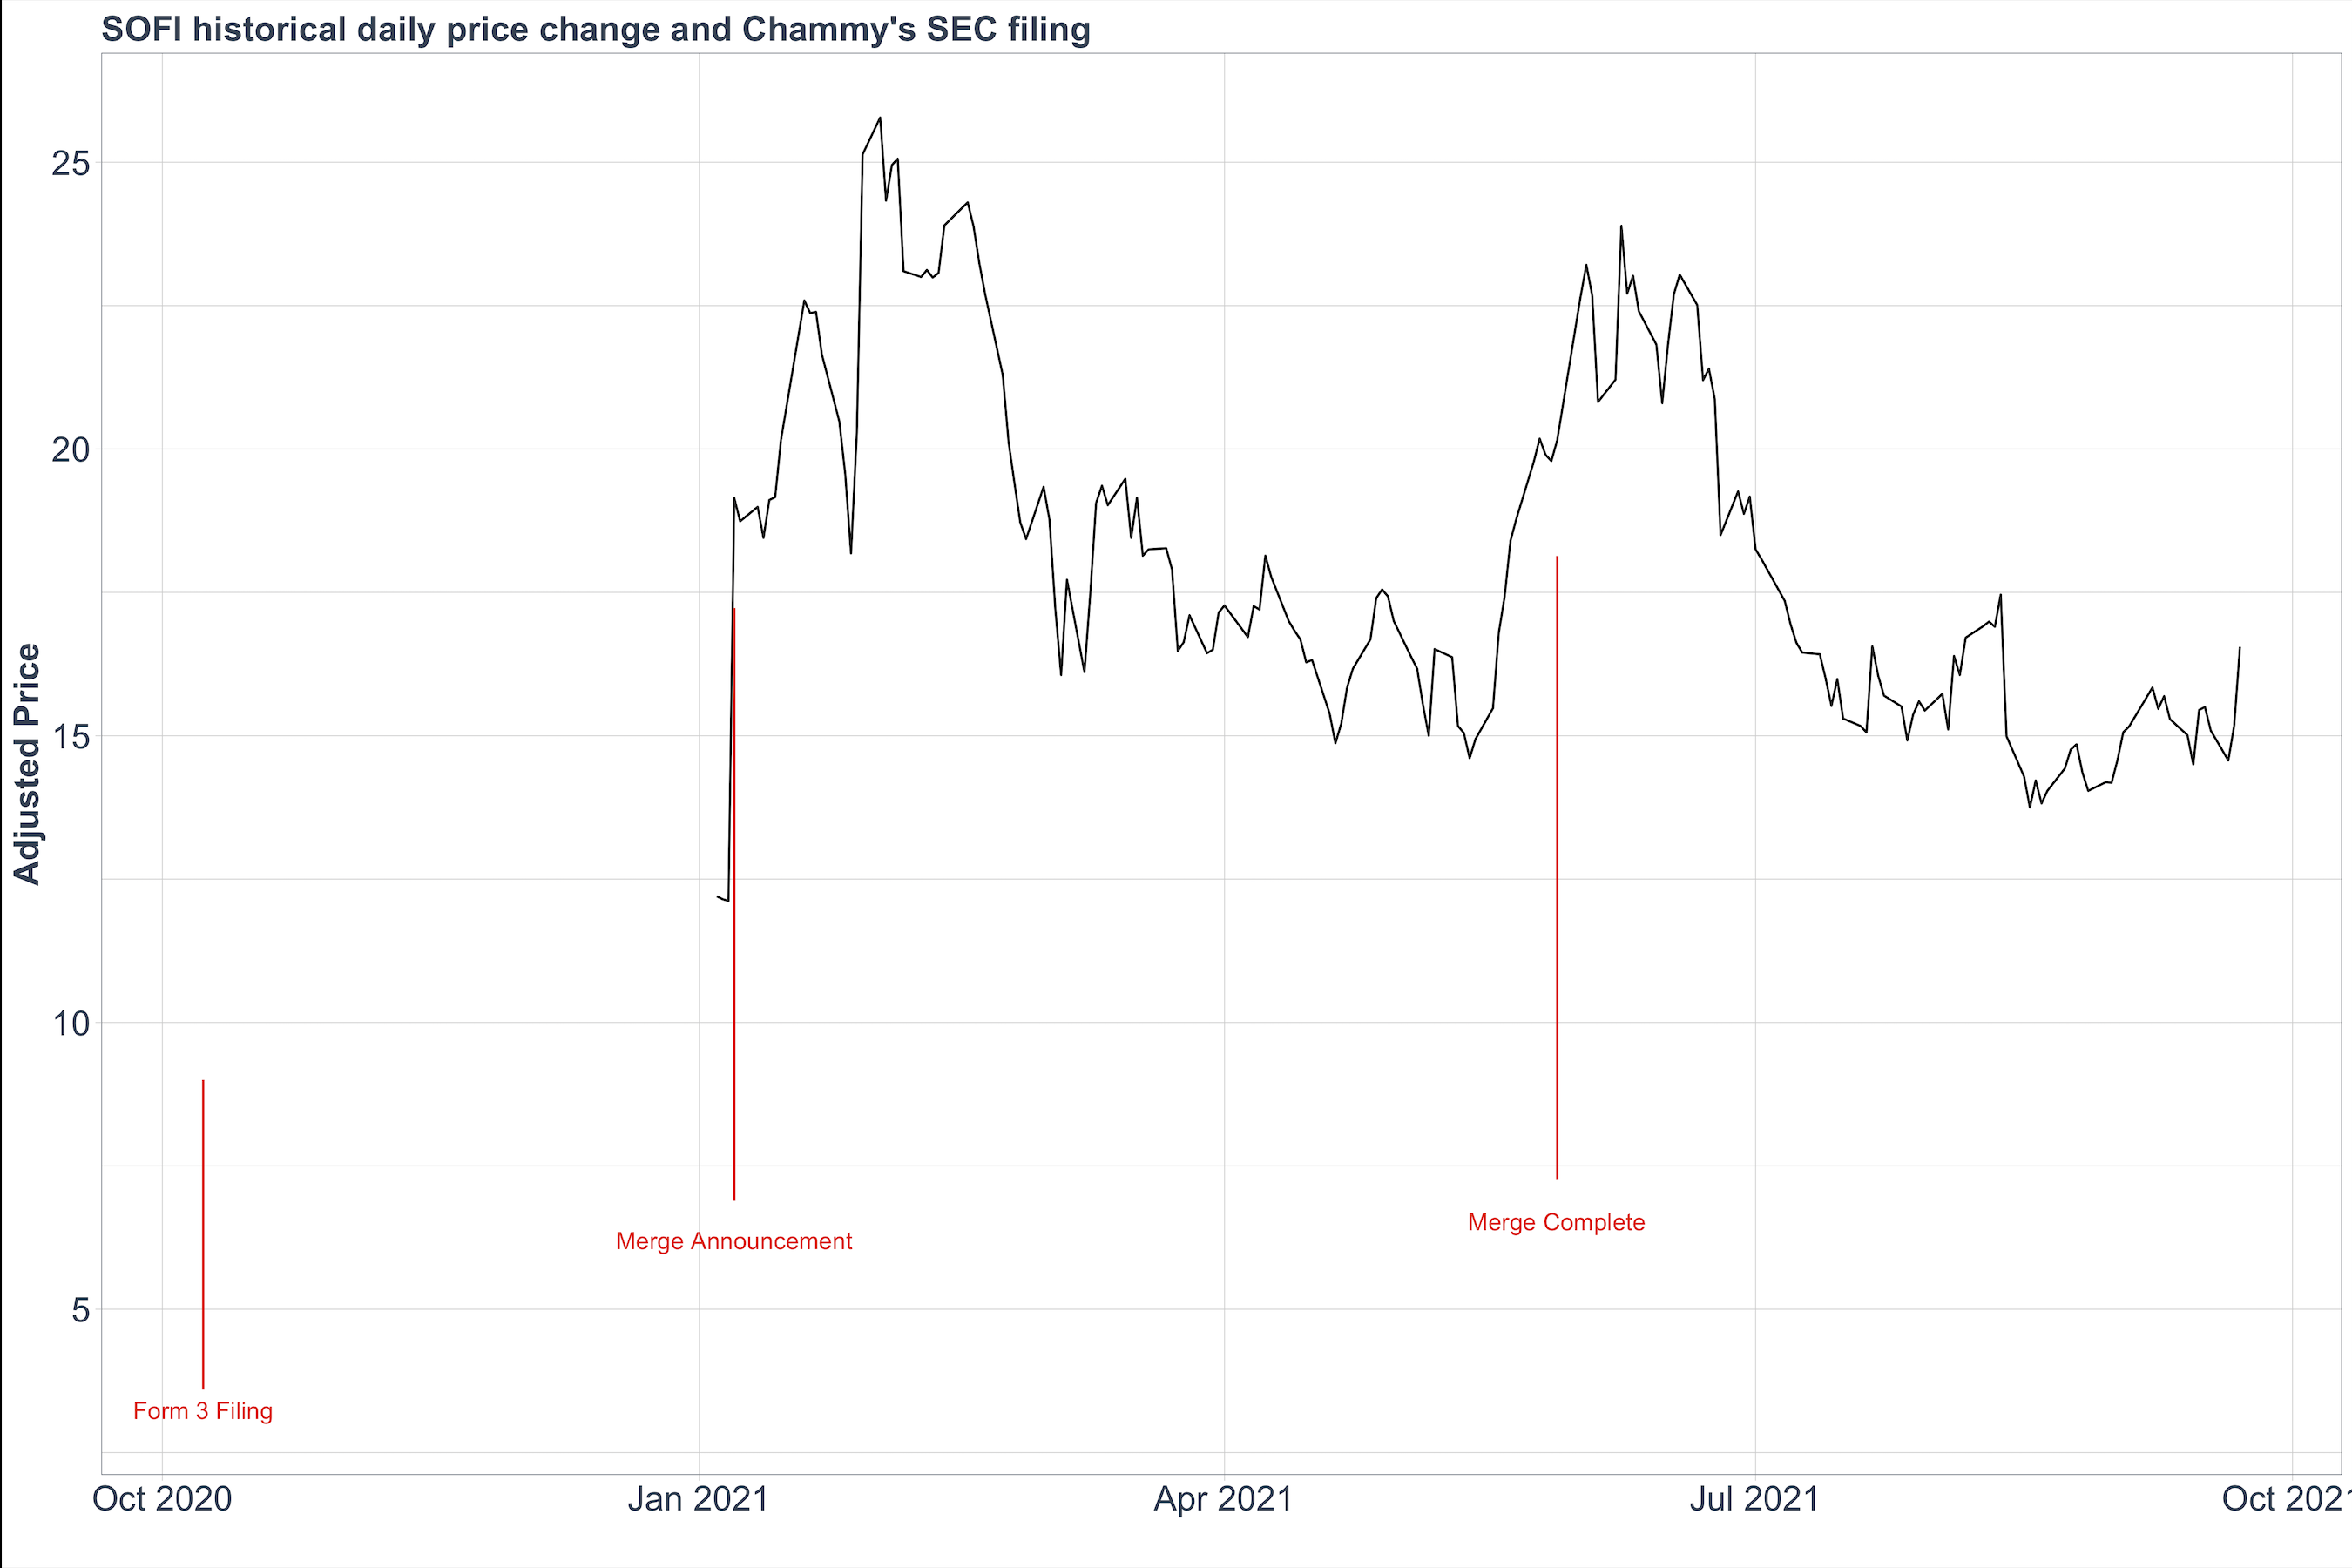
Performance analysis: Chamath’s SEC filing and SPAC price change
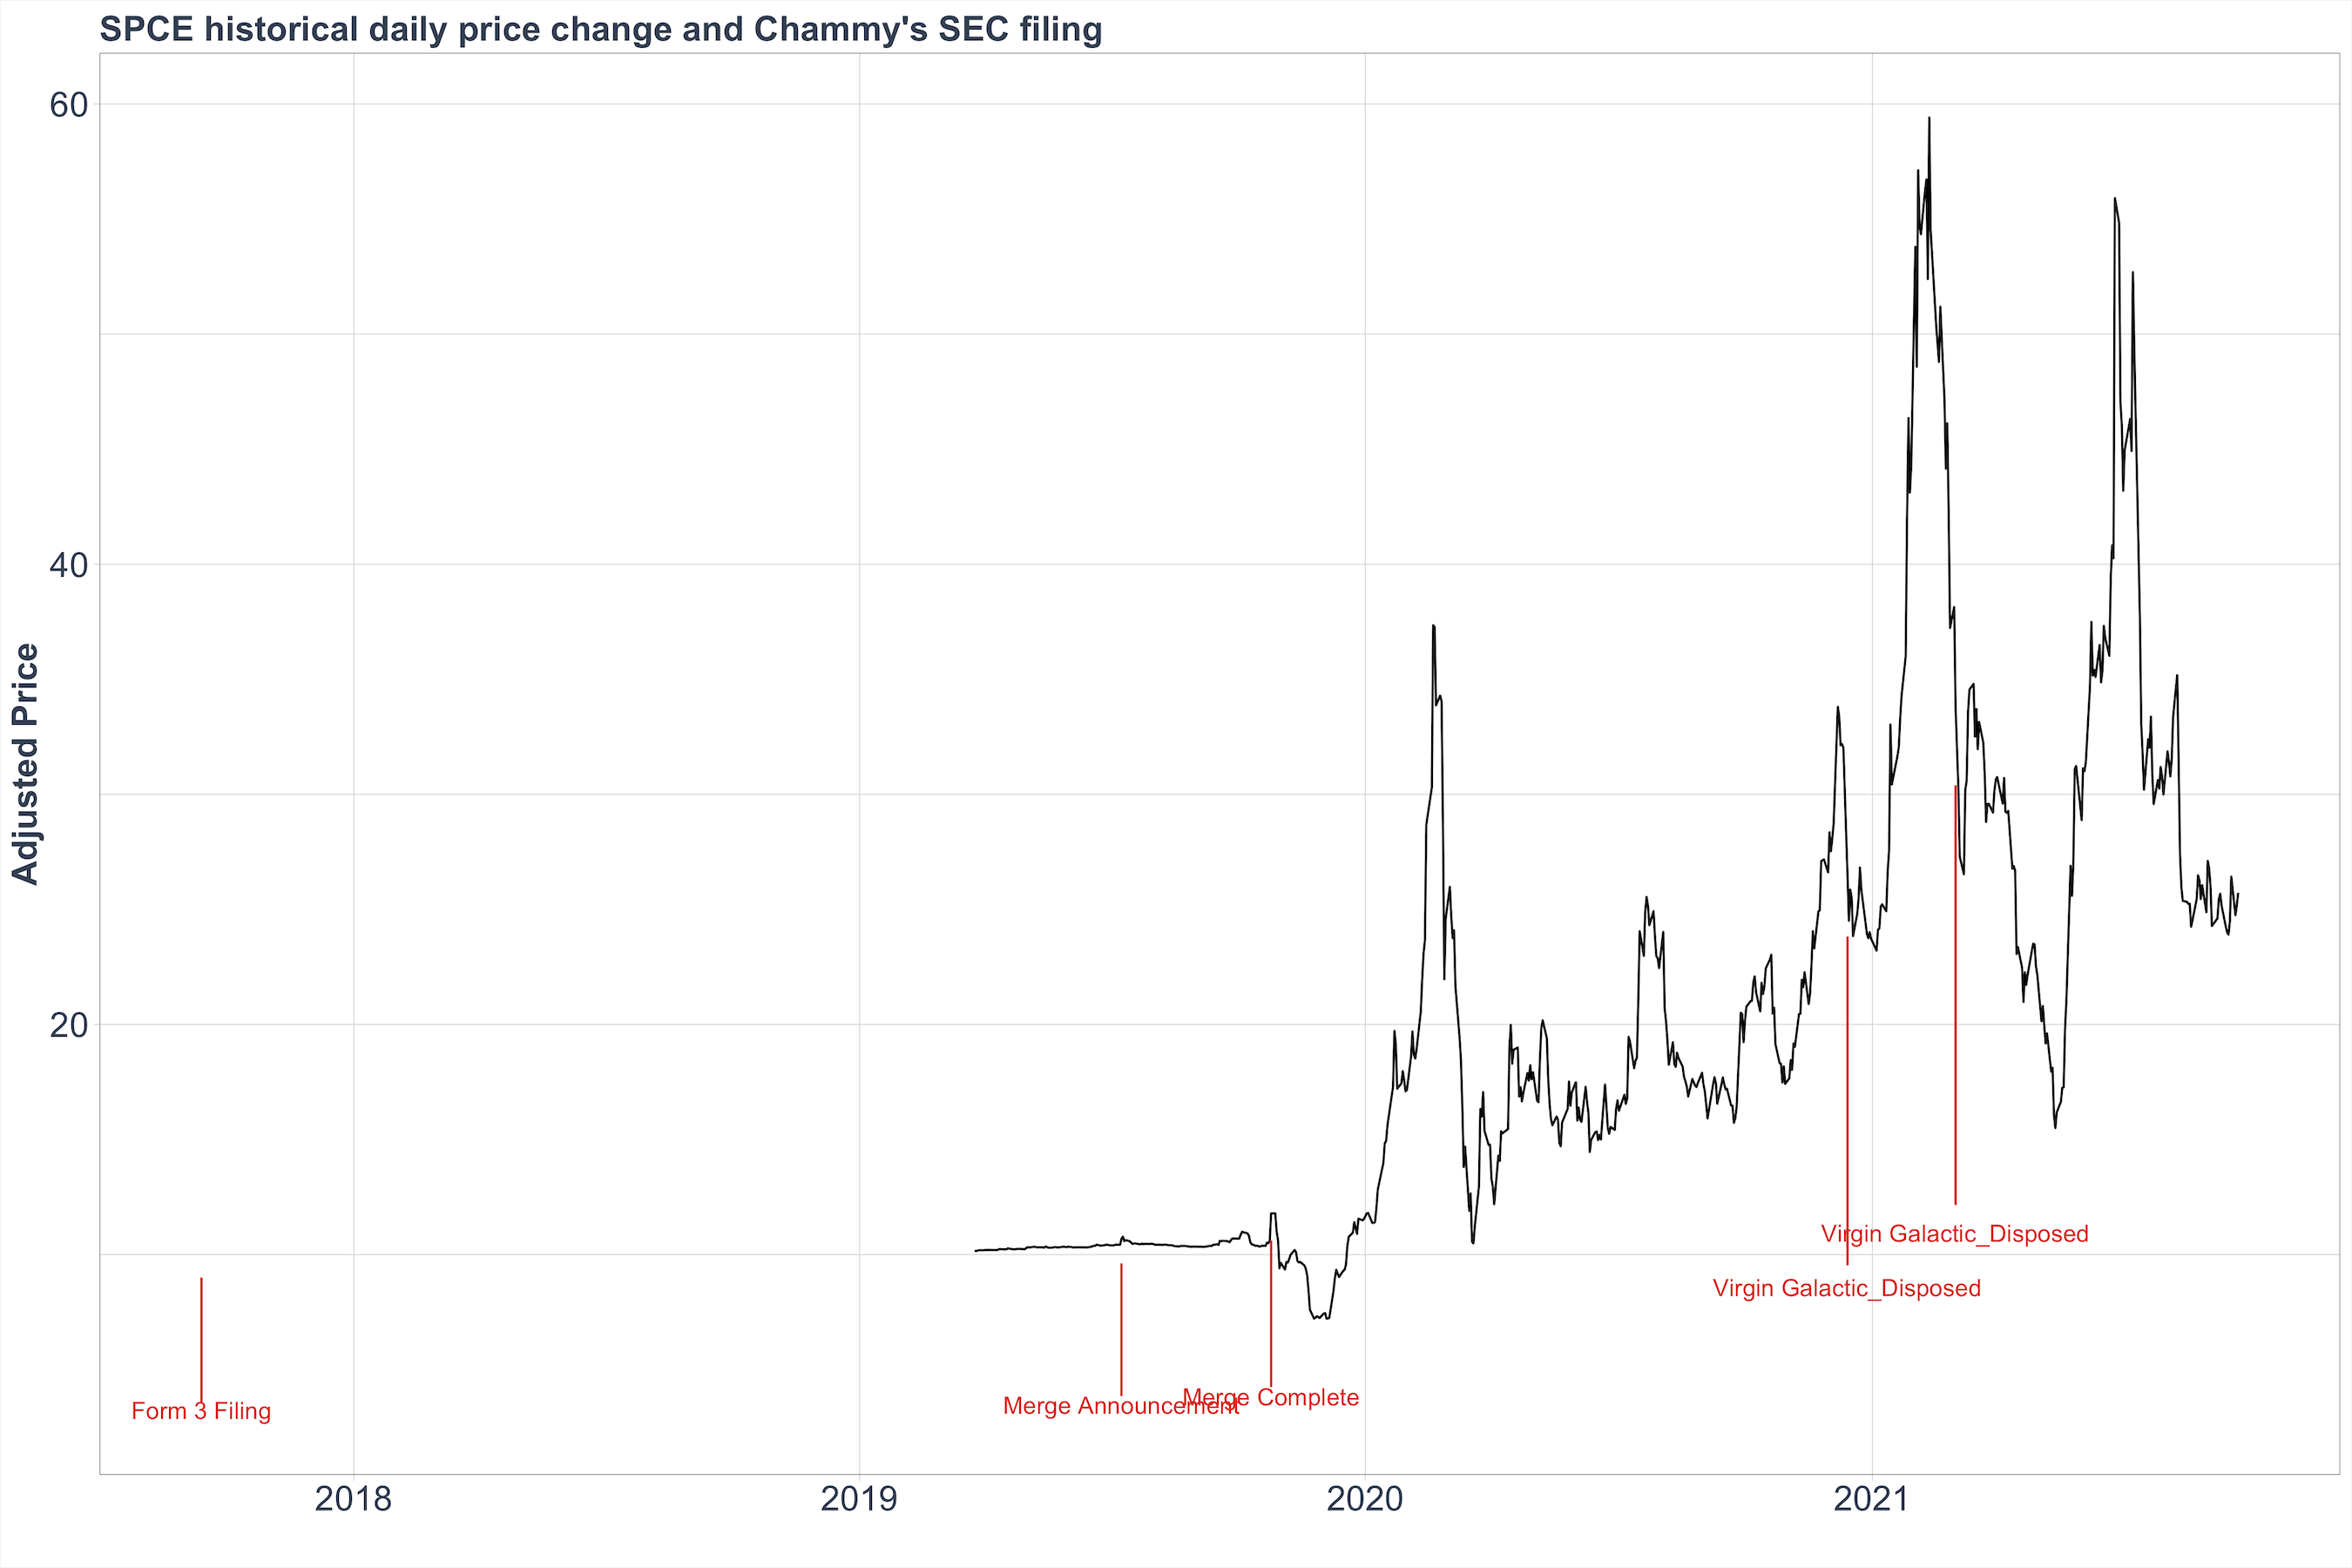
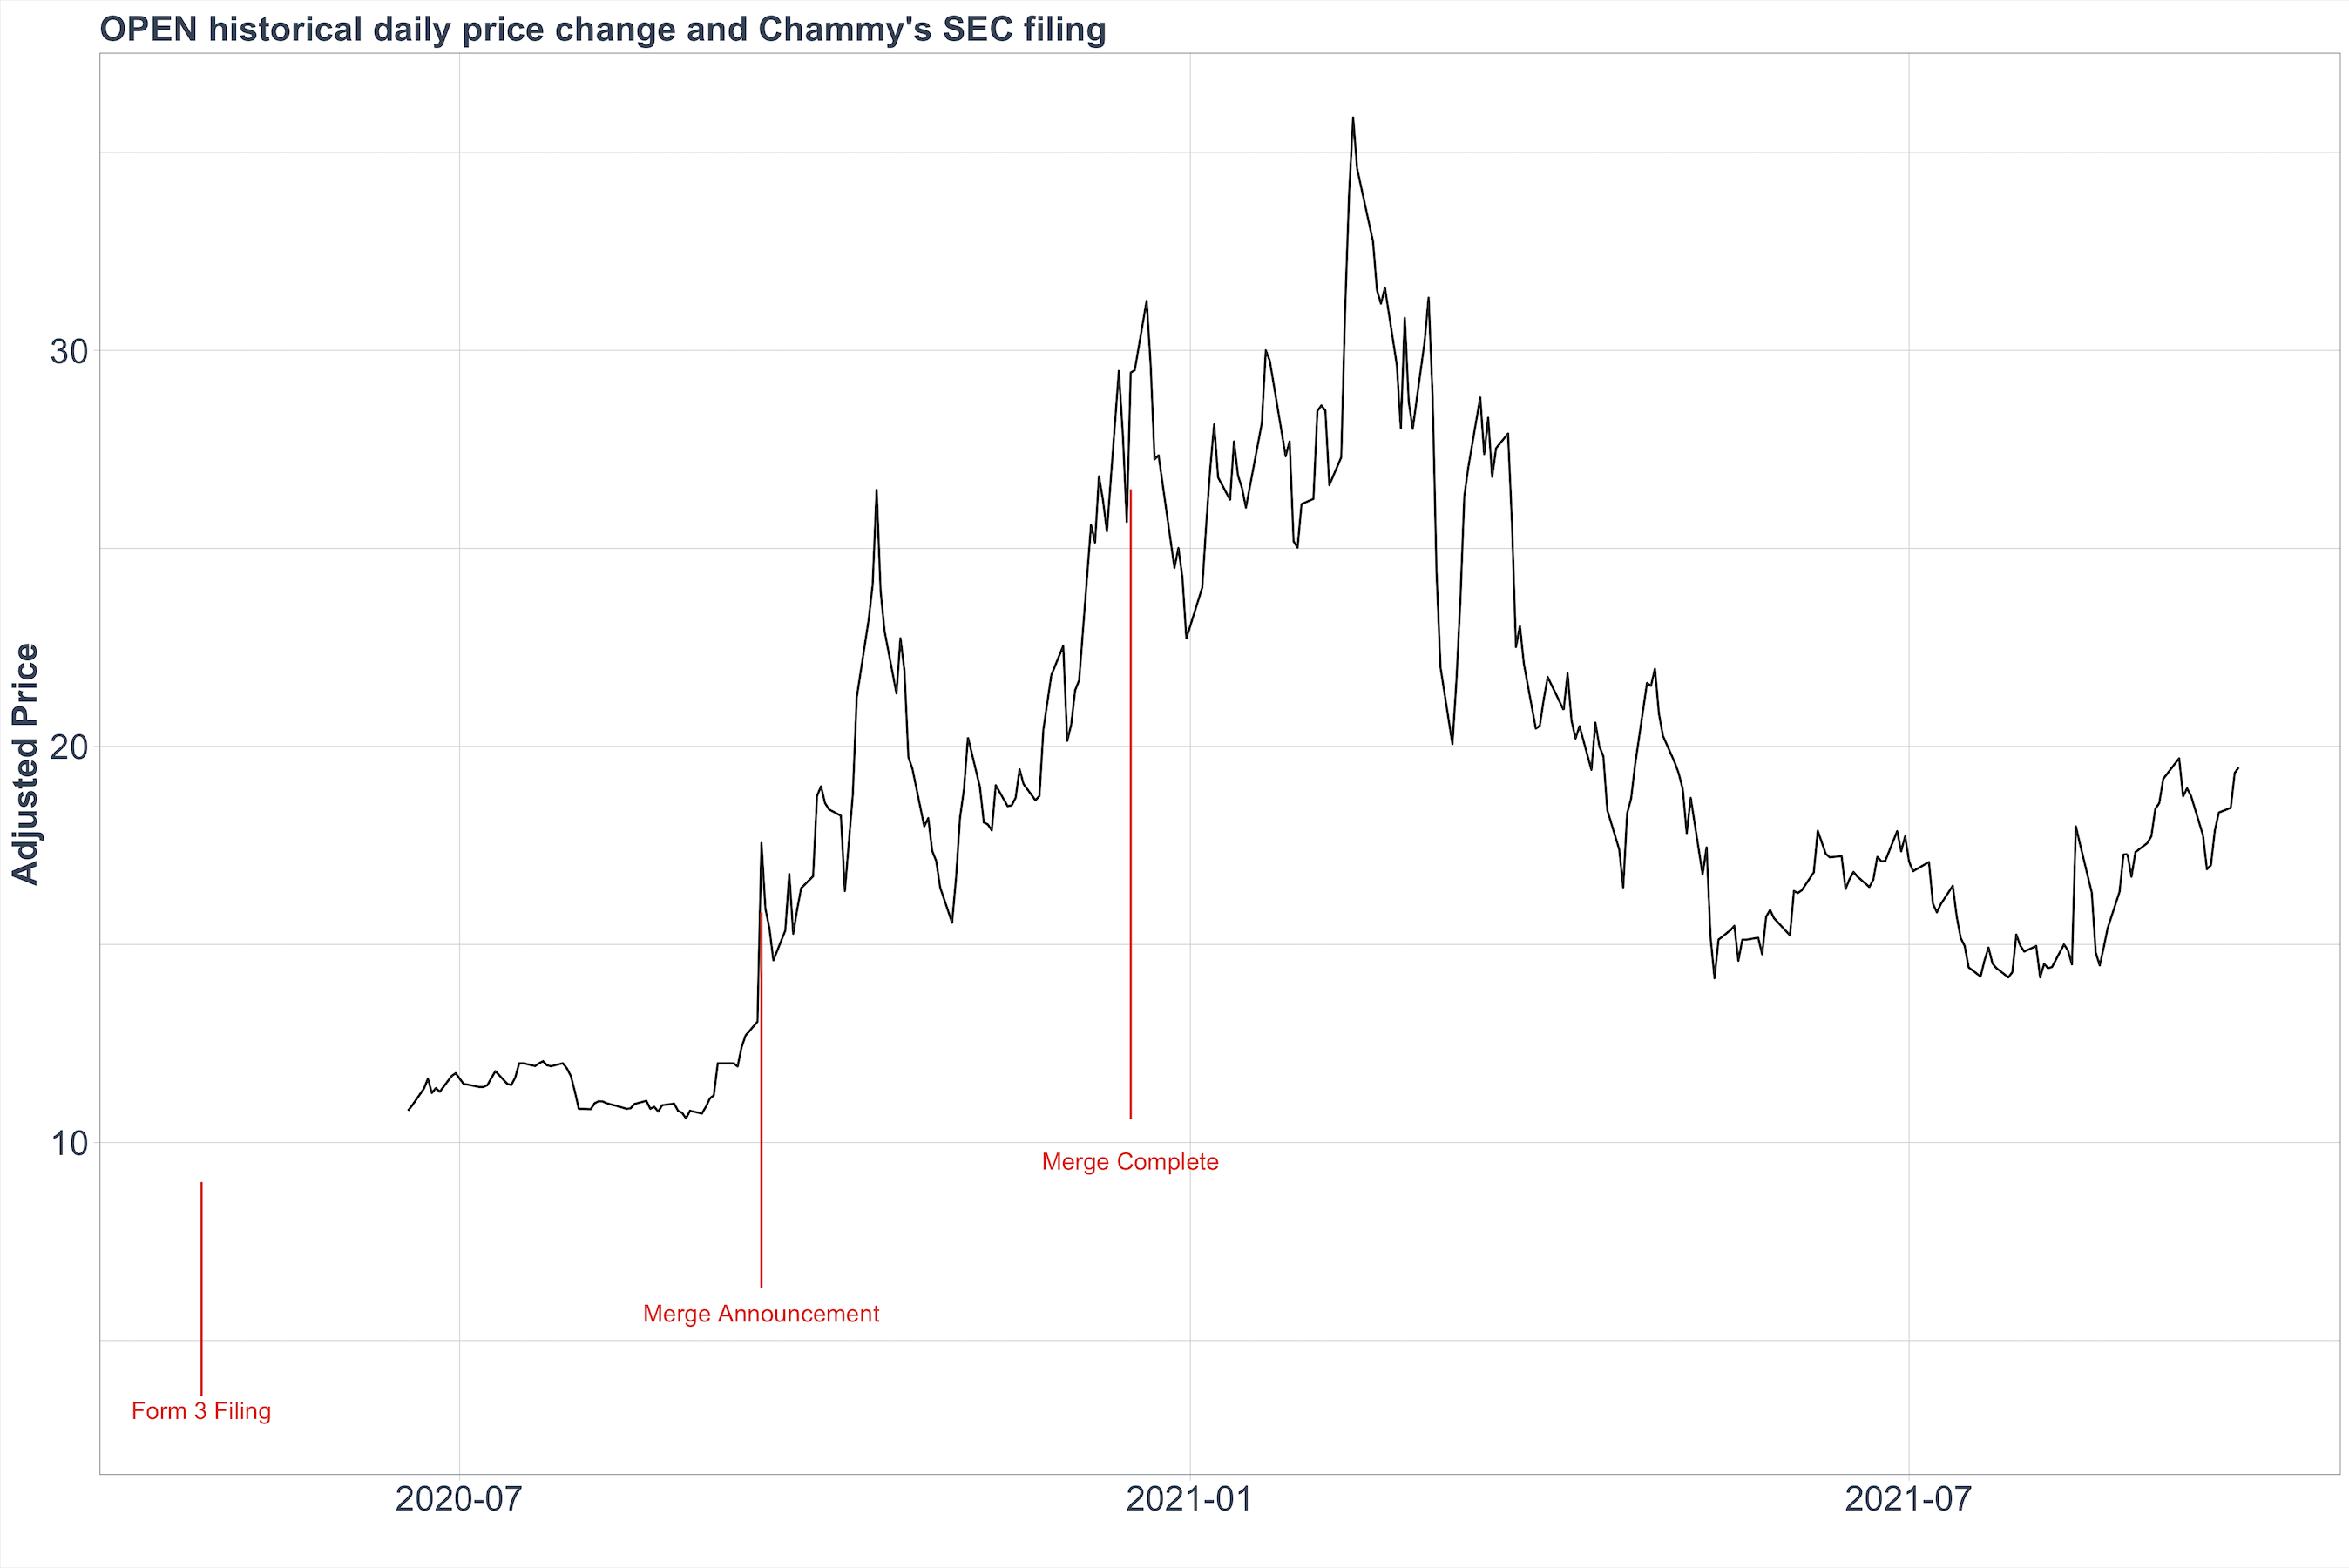
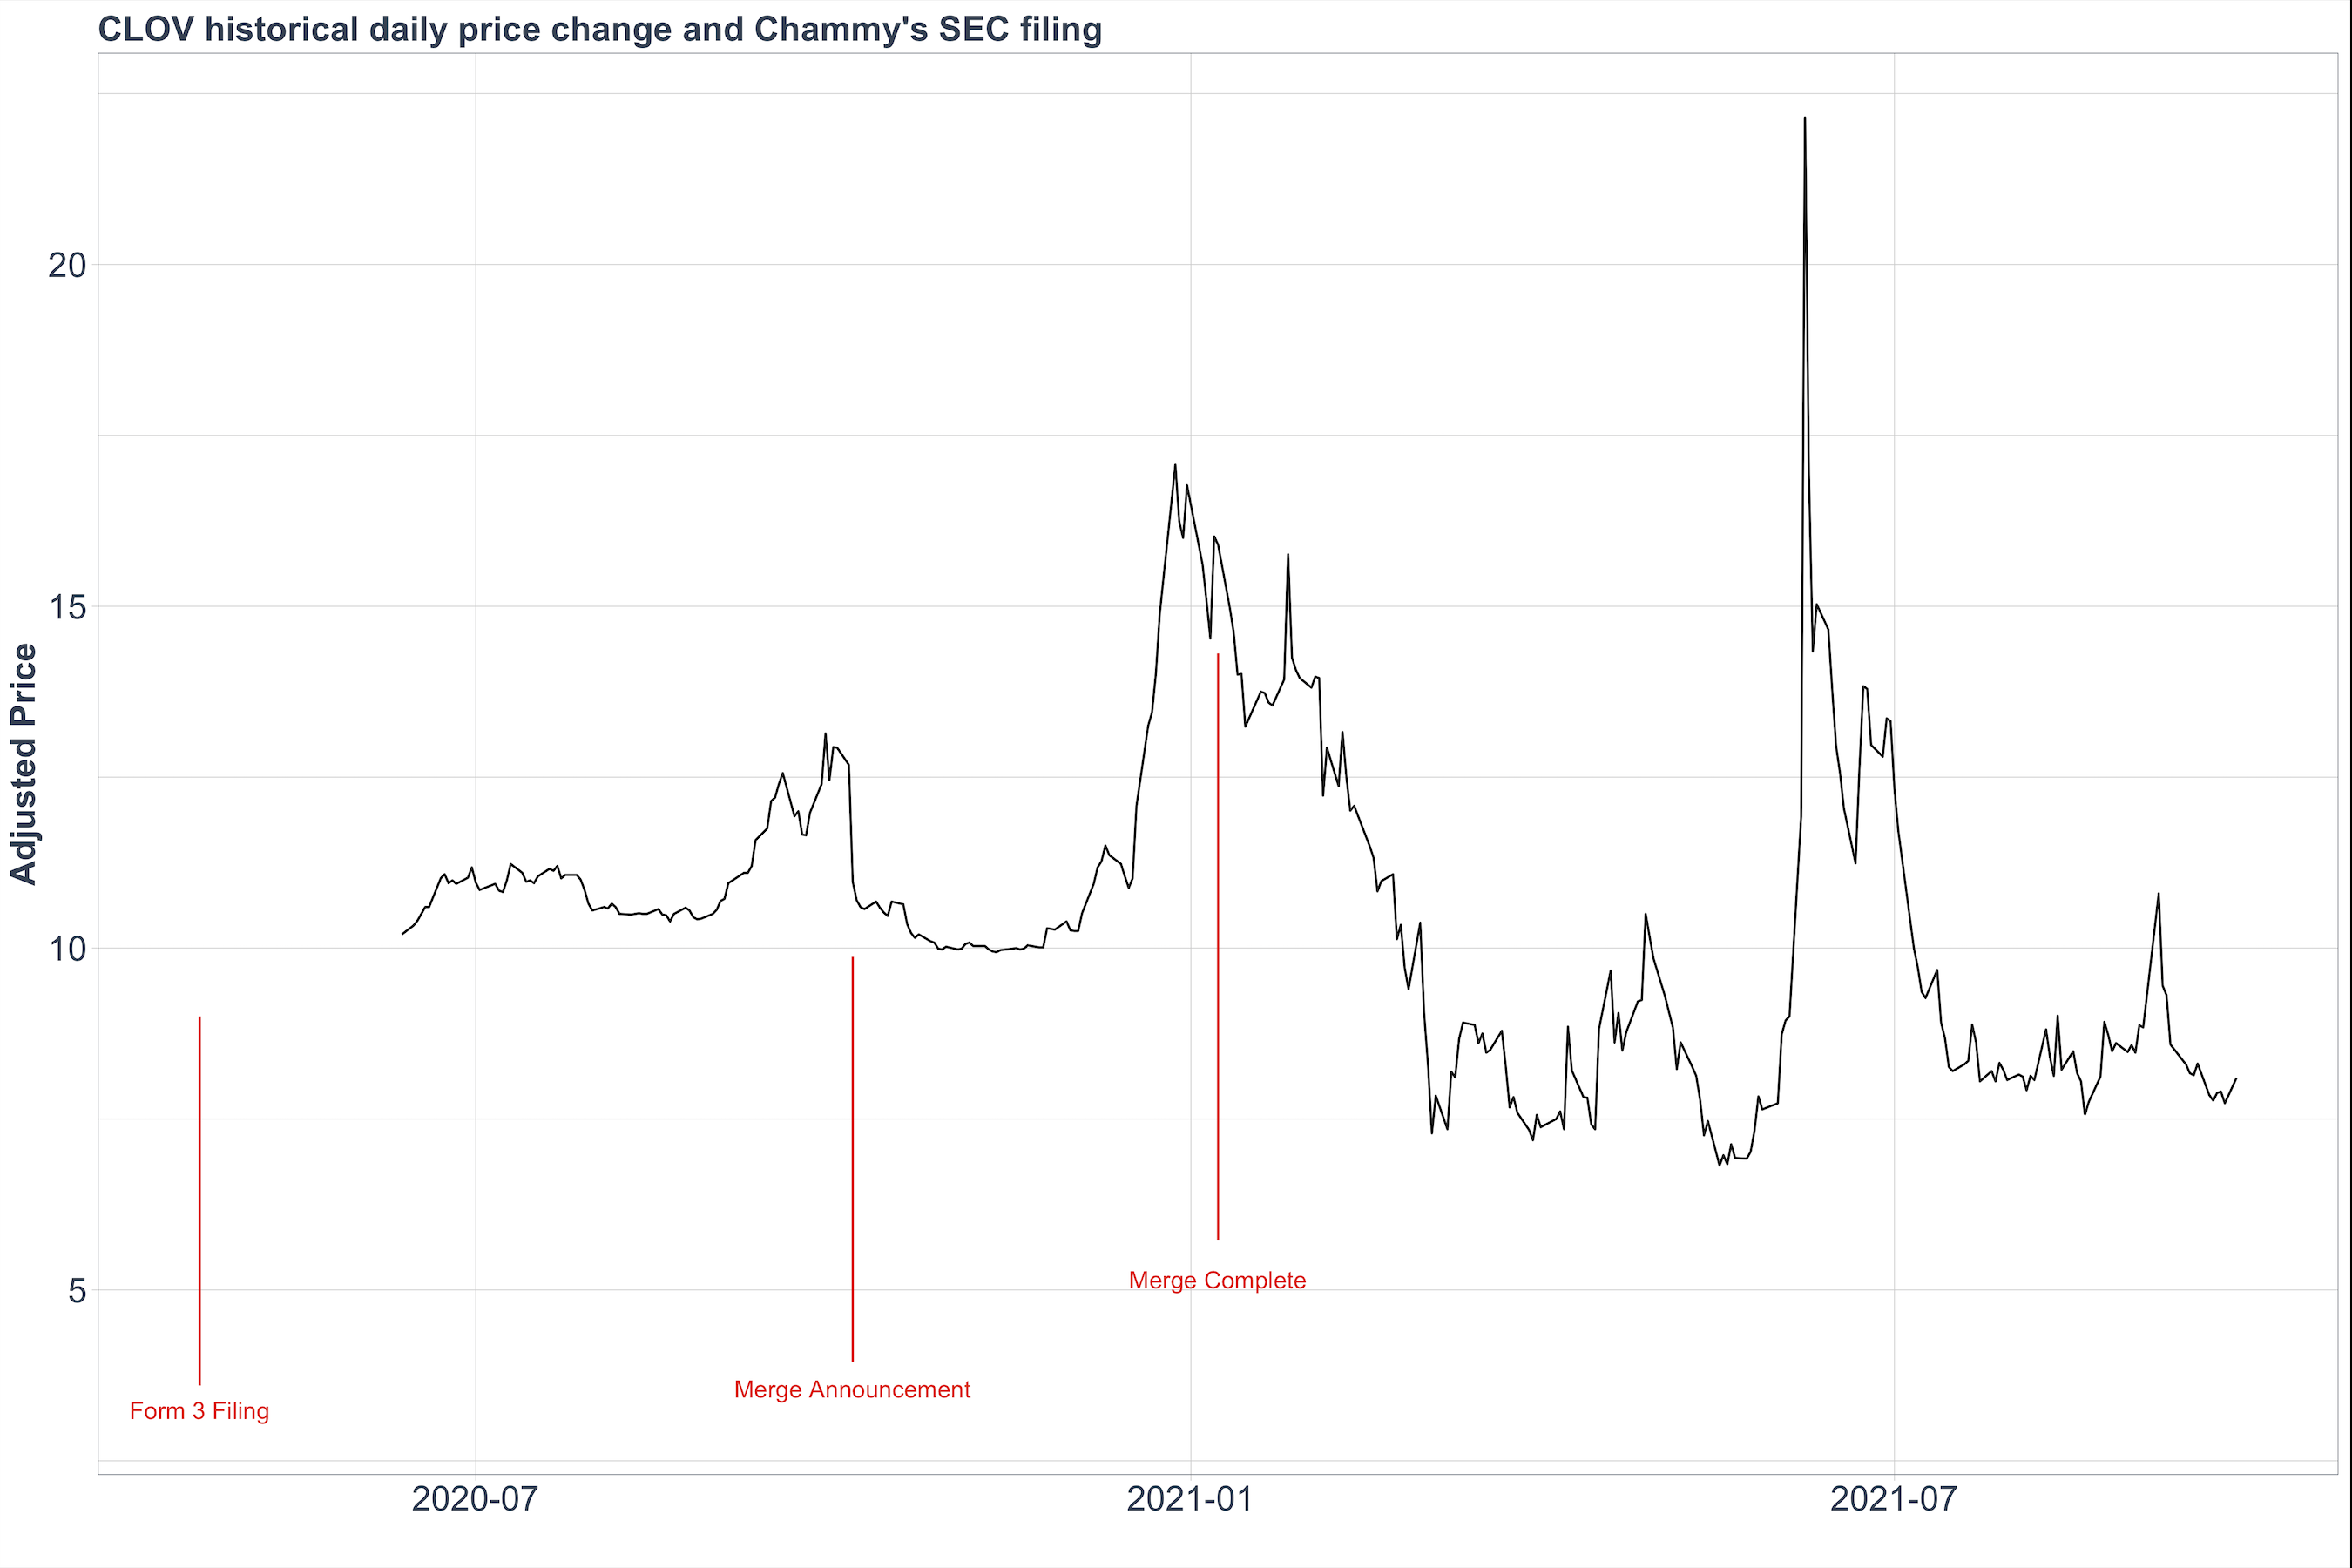
From analyses so far, it’s safe to say that Chamath’s SPACs are highly volatile yet similar. The final analysis will try to identify events affecting the behaviour of his SPACs in hopes of offering retail investors some insights and actionable information. While private equity and institutional owners are beyond the scope of this report, public information on Chamath’s own trading decisions are fairly scarce.In Fig. 13, Chamath’s SEC filings are labelled on each SPAC’s price history. It appears that merger announcements or completed mergers are main drivers for price jumps. Price dips are much harder to predict via his public records. Chamath dumping SPCE shares appears to be his reaction to declining share prices, as indicated in his March 7th tweet.
Figure 13: Chamath’s SEC filing and SPAC price movements
Comment and discussion:
Chamath and his SPAC portfolio was SPACtacular in 2020, but so were most SPACs, and the general market. No one could deny the success his SPACs were enjoying that year. We should all praise his determination to push boundaries through experimentation. This report shows that his SPACs behave similarly to each other, and differently from the rest of SPACs. To quote Buffett: “Anyone can pick a winner in a bull market. Picking out winners in a declining market is where true greatness is found.” We see that Chamath’s SPACs have been heavily impacted this year, like many other SPACs. Therefore, being deemed the “King of SPACs” might be more of a media exaggeration during a bull-market, when putting his SPACs into this 2-year time window. Time is the ultimate test for his continued SPACtacularness.Nevertheless, Chamath is a successful venture capitalist with a great vision for the future and a deep understanding of technology. As tough as 2021 has been for Chamath, he’s doing fine especially after selling off $213 million in SPCE shares.
In other words, although Chamath thought he may have messed things up (fyi), he's still has a long night to go to become the next Buffet.