Implied Volatility: A Primer
Implied Volatility is fairly self-explanatory. However, conceptualizing it can be tricky.
Let’s take a quick look at volatility, implied volatility, probability, contract pricing models, memes, and a few things in between.
Volatility, Implied Volatility & Historical Volatility
First off, some definitions:
- Volatility: The amount the stock price fluctuates.
- Implied Volatility: Forward‑looking potential volatility (market’s best guess at future swings).
- Historical volatility: The actual volatility of the stock—what it did in the past.
A few basic relationships:
- When a stock falls, IV typically increases.
- When a stock rises, IV typically decreases.
- When IV rises, option prices rise.
- When IV falls, option prices fall.
Why do I say “typically”? Because on rare occasions—earnings reports or major news (e.g., pandemic updates)—a stock can rally while IV still increases. If you'd like to learn more about, check out our primer on Implied Volatility Crush.
Implied Volatility as Probability
Implied Volatility is simply the probability that the underlying price will fluctuate ± X % from where it is over the life of the contract. Here, X % = the IV.
AAPL Example: Implied vs Historical Volatility
Note: All data in this example is from June 21, 2022, when the article was first published. These numbers are for educational purposes only and are not current.
To visualize IV vs historical volatility (HV), consider AAPL, a relatively low-volatility stock. The table below compares AAPL's "current" average, 52-week high, and 52-week low 30-day IV (IV30) against the 20-day and the 252-day HV.
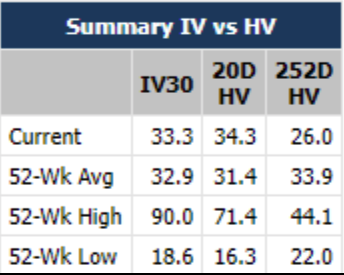
This table shows, for example, that the current 30-day IV was about 33% at the time of publication, while the 20-day HV was 34.3%.
This implies that over 30 days, there's roughly a 68% probability AAPL will stay within one standard deviation of its price and a 32% probability it will exceed that range.
IV as Probability
Implied Volatility is simply the probability that the underlying price will fluctuate ± X % over the life of the contract (where *X % = the IV).
This bell curve shows how AAPL's 33.3% IV translates into price ranges: 68% of outcomes lie within ±1 standard deviation, while 32 % fall outside.
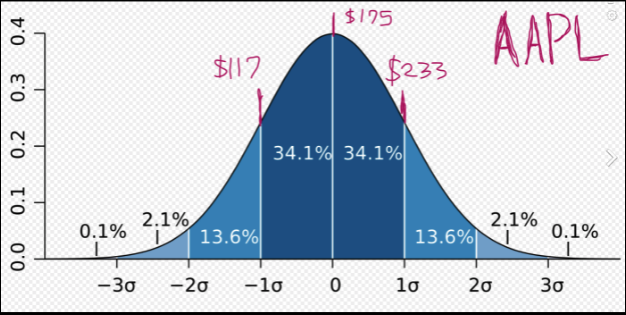
No need to comment on my superb art skills; I know I'm good.
Per-Chain and Per-Contract IV
The same probability logic applies when IV is quoted per expiration or per contract. For example, an at-the-money AAPL call expiring that week ($175) had 48% IV—higher than the 30‑day IV because it reflected a shorter time frame and more “gap risk.”
Why Does IV Spike Near Expiration?
Two reasons:
- Gap risk. Short‑dated contracts are more susceptible to sudden news or volatility spikes. Sellers raise premiums to compensate, which pushes IV higher.
- Model limitations. Many brokers still use Black‑Scholes, which assumes a normal distribution of returns. In reality, returns are lognormal. This mismatch can skew the Greeks—especially gamma and vega—creating artificially high IV on the tails.
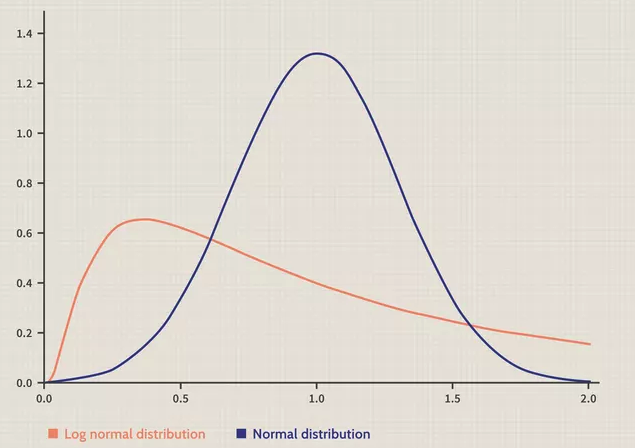
This plot illustrates why assuming a normal distribution understates tail risk, contributing to spikes when using Black-Scholes.
More Options Education from Unusual Whales
- Implied Volatility Crush: A Primer – Explains IV crush around earnings and why premiums collapse after events.
- Gamma: A Primer – Defines gamma as the change in delta per $1 move and shows why gamma ramps near expiration.
- Delta: A Primer – Defines delta as the rate of change of an option’s price per $1 move and how it gauges the probability of finishing in the money.
(Editor's note: This article was updated for clarity on November 11, 2025)