Stock Splits: A Deep Dive Analysis

Updated: Amazon flow information displayed at bottom of post.
Google’s recent 20-for-1 stock split announcement sparked lots of interest. Immediately following the announcement, shares in after hours trading surged upwards of 10%. Volume the day after the announcement was 6.16 million, which is 30% higher than the average for the last 4 earnings reports. Did the split play a part in that? It seems highly likely.
When Tesla and Apple’s stock split on August 28th, 2020, the following day’s shares ran up 10% in the session, but for what reason? Does a split affect a stock’s price at all?
Well, let’s take a look at it.
TL;DR
- Stocks increased an average +4.95% between the date the split was announced and the actual split date
- Megacaps are hot for splits
- On average, following the split announcement date, stocks returned ~+3% within 5 days
- Best time-money return was observed within 5 days for both split dates and announcement dates
Why do stocks split?
Let’s say we have ticker XYZ trading at $100 with a float of 10 million shares wants to have more shares actively circulating through the market, or maybe they are offering shares to employees and deem $100/share too pricey if they promise X amount of shares a year. So, XYZ splits 4-for-1, taking the total share price down to $25 a share, and increasing the float to 40 million shares.
Forward splits are typically taken as a sign that the company is performing well, but also insinuates that the share price is simply unaffordable. For instance, Tesla split at about $2000/share and for many retail investors buying shares, that’s dang pricey. From the options world, 1 ATM pre-split Tesla contract would be controlling $200,000 worth of Tesla shares, should exercise happen. That’s quite a hefty amount, and might steer traditional option investors away from the company due to cost of exercise, and potentially even some funds.
By splitting 5-for-1, Tesla’s share price dropped to about $400/share, which is $40,000 on exercise for an ATM contract. Not as intimidating for the average retail investor, and this move also supplies more liquidity in the market, which is inherently a good thing.
There are also reverse split events that consolidate shares and increase the price per share. For example, following the wake from the 2008 financial crisis, Citi Group ($C) issued a 1-for-10 reverse split when their share price was around ~$3. That meant for every 10 shares you owned, following the split you would have 1 share.
Why do reverse splits happen? Well, these are typically a sign the company is in some financial trouble. These companies could decide to do a reverse split for multiple reasons:
- Increase price per share: This potentially makes it more attractive to average investors through some basic psychology, where those less experienced in market dynamics might think “this stock sucks because it’s $10, and this one is good because it’s $50”
- No money, Mo’ problems: The company’s share price perhaps has fallen to single digits, or even sub $1. Typically, short sellers are very active when a company’s valuation is in decline, so by reverse splitting, it makes shares harder to borrow for short sellers, perhaps forcing their hand in closing their positions. However, a higher share price might make it more appealing to short sellers should they remain bearish on the company, as there’s more room to profit.
- Delisting threat: A company’s share price falling low might run the risk of delisting from an exchange. According to the NASDAQ, their exchanges require the stock to have an initial minimum bid price of $5 a share, and must remain above $1. If the company’s stock falls near that range, they may issue a reverse split due to the exchange’s rules. $SNDL, Sundial Growers, might be a candidate for this due to the NASDAQ giving them 180 days for their share price to trade above $1 for 10 consecutive days.
About the Data
This analysis includes all stock splits since January 2020. There were 4,248 split events. The majority of these splits were by micro-microcap companies (< $100 million market cap) which had tons of volume but no price movement or no volume at all. These were excluded. OHLC data was available for approximately 500 tickers.
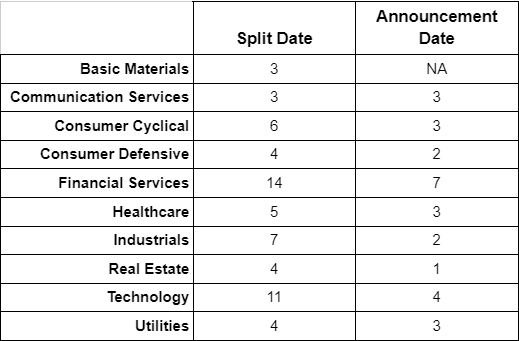
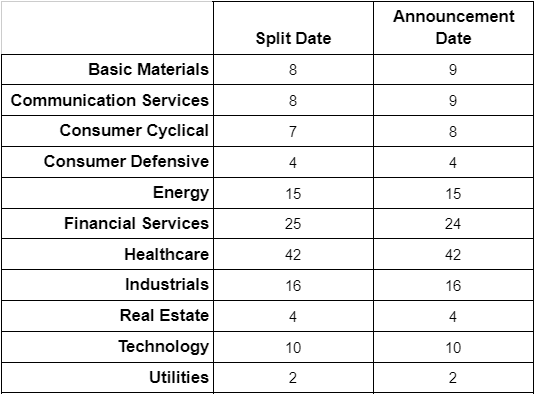
The counts of tickers per sector are listed below.
Summary of Forward Stock Split Data
Summary of Reverse Stock Split Data
This report analyzes the effect of stock split announcements and actual split events affected these tickers. I looked at forward / reverse splits, market cap considerations and sector differences. This report does not control for compounding events like earnings or dividend announcements, it just analyzes purely off of split / split announcement movement.
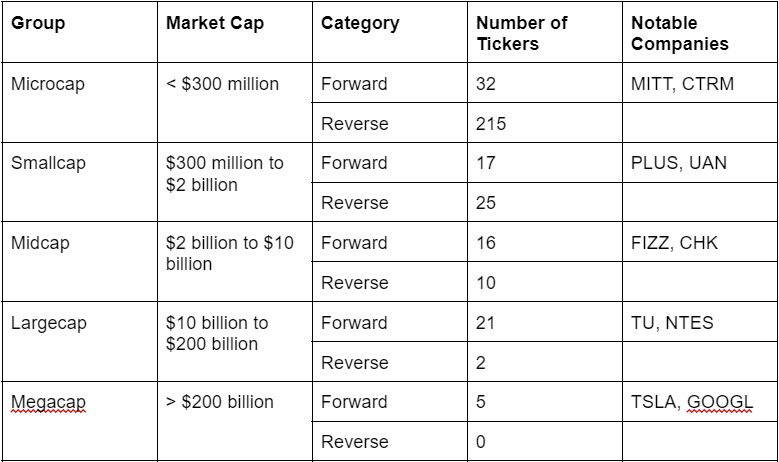
Summary of Stock Split Data Categorized by Market Cap
How do stocks perform after a split is announced?
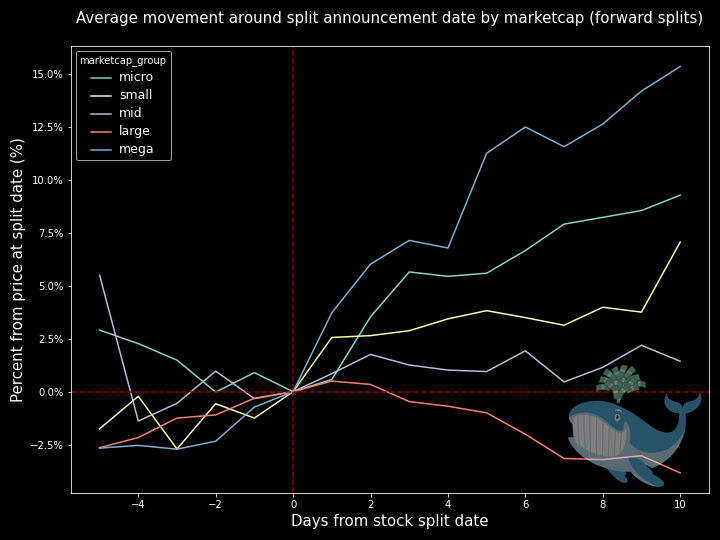
First, let’s look at what happened to stocks when a split was announced. To determine the effect of the announcement, I looked at stock price movement 5-days before the announcement date and 10 days after. The following charts track the average share price movement relative to the stock split announcement date.
By Marketcap
Forward
Reverse
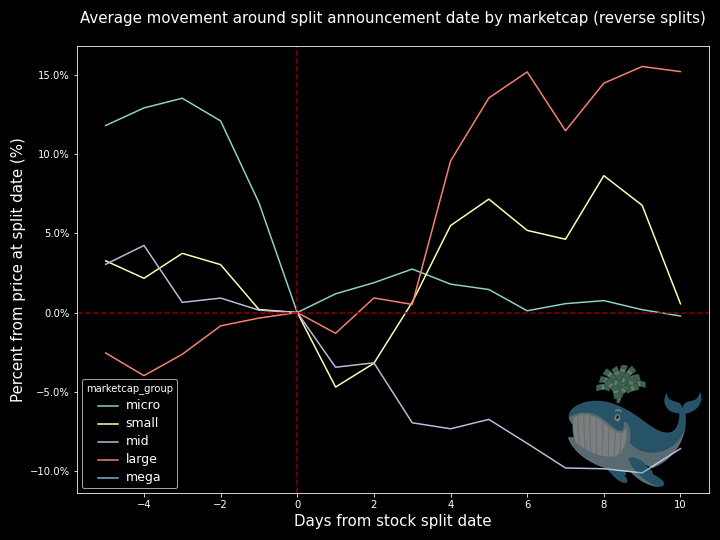
Excluding large caps, average share price rises following the split announcement. As mentioned, forward splits are typically bullish. Large and mega caps rallied following the announcement of their splits peaking at 15% and 8% respectively, An interesting note is that large caps drifted lower for the duration, suggesting marketcap might not be as important of a factor. For reverse splits, however, the average share price increased upward for all except mid caps.
Note: Microcaps were excluded from the reverse split chart. During data wrangling, most data regarding microcaps and splits were for OTC penny stocks. The nature of these assets produced some wide % numbers, skewing the data grotesquely (ex. $0.15 jumping to $4.50 on little to no volume), so they were excluded for this part.
By sector
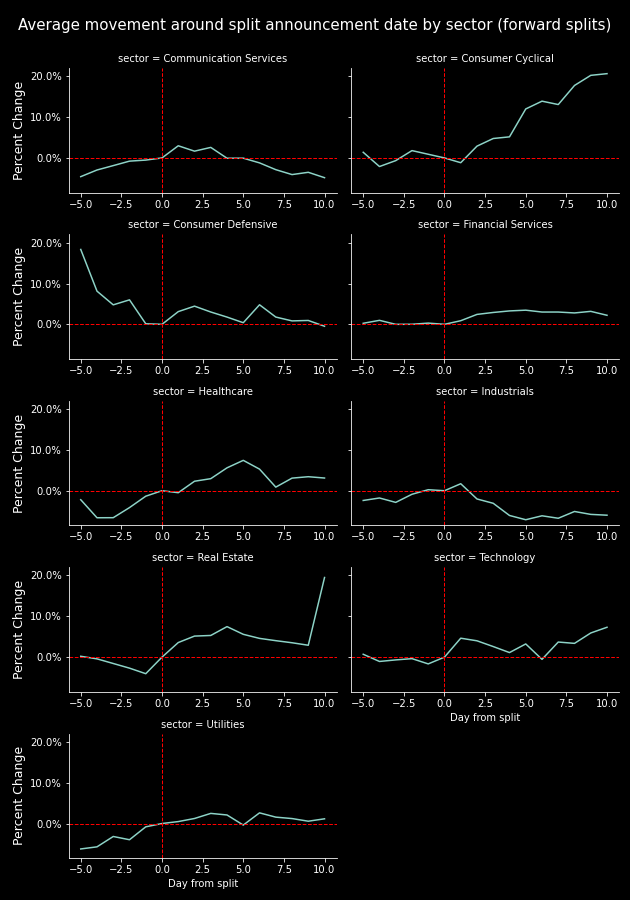
Forward
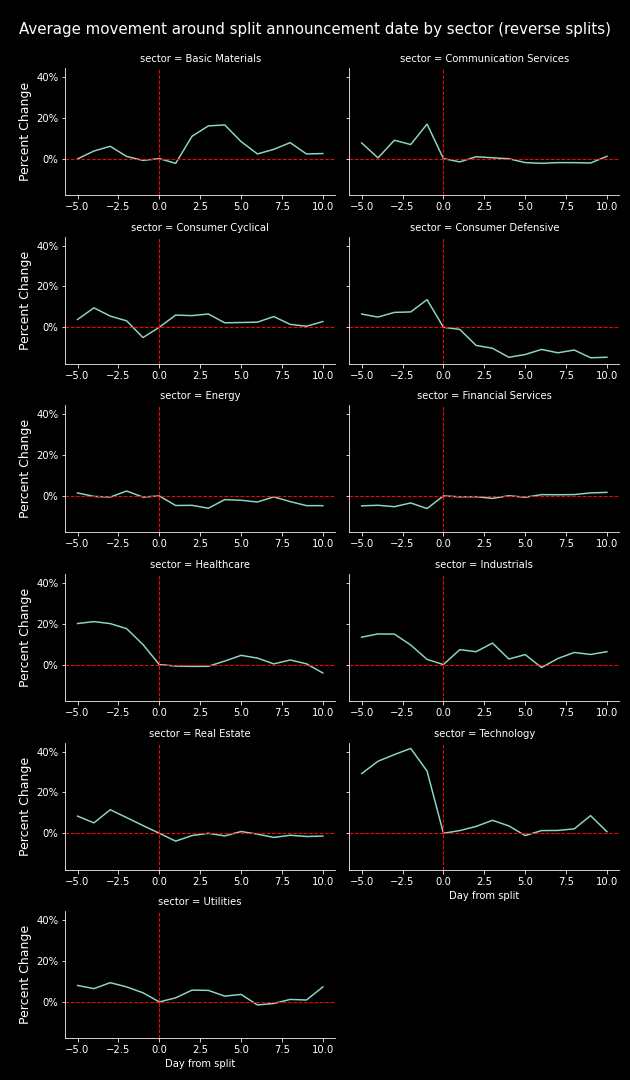
Reverse
Grouping by sector told a similar story, with the average price change increasing for the majority of sectors following the announcement date.
How do stocks perform after a split?
This next section will focus on the split event and the effect on the stock price. For this analysis, I wanted to see any longer term effects, so I looked at 15-days before the split date and 30-days after. The following charts track the average price movement relative to the stock split date.
By Marketcap
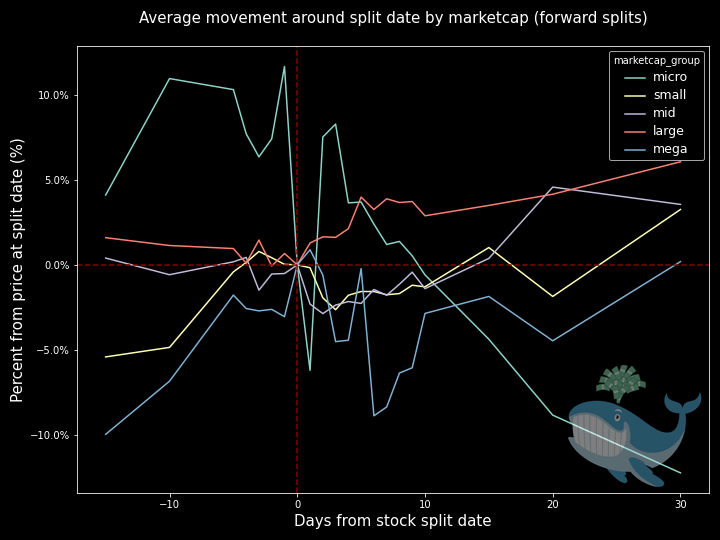
Forward
Reverse
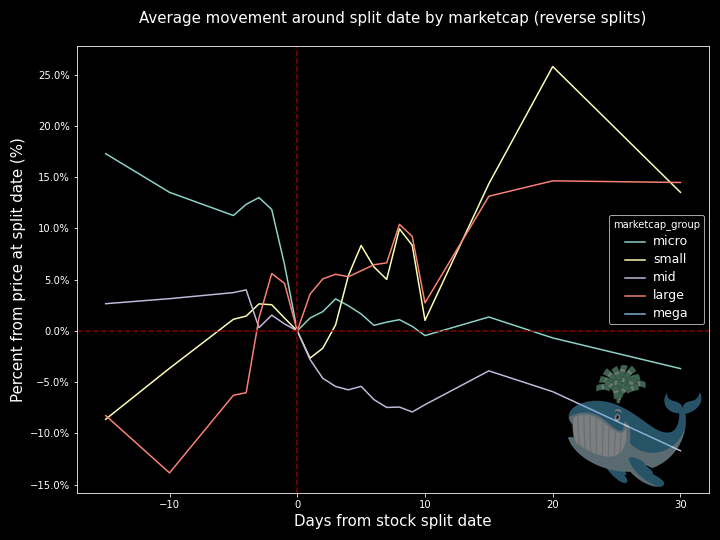
Compared to movement around the announcement date, movement pre/post split date was much different. Largecaps and smallcaps stocks gained up to 15% post-split, while other marketcaps fell following the split.
By Sector
Forward
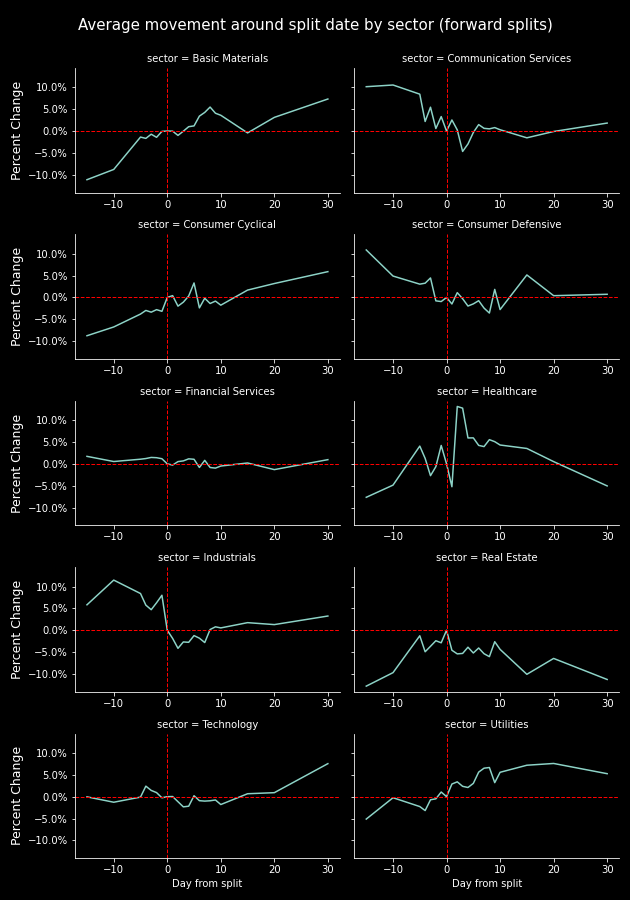
Reverse
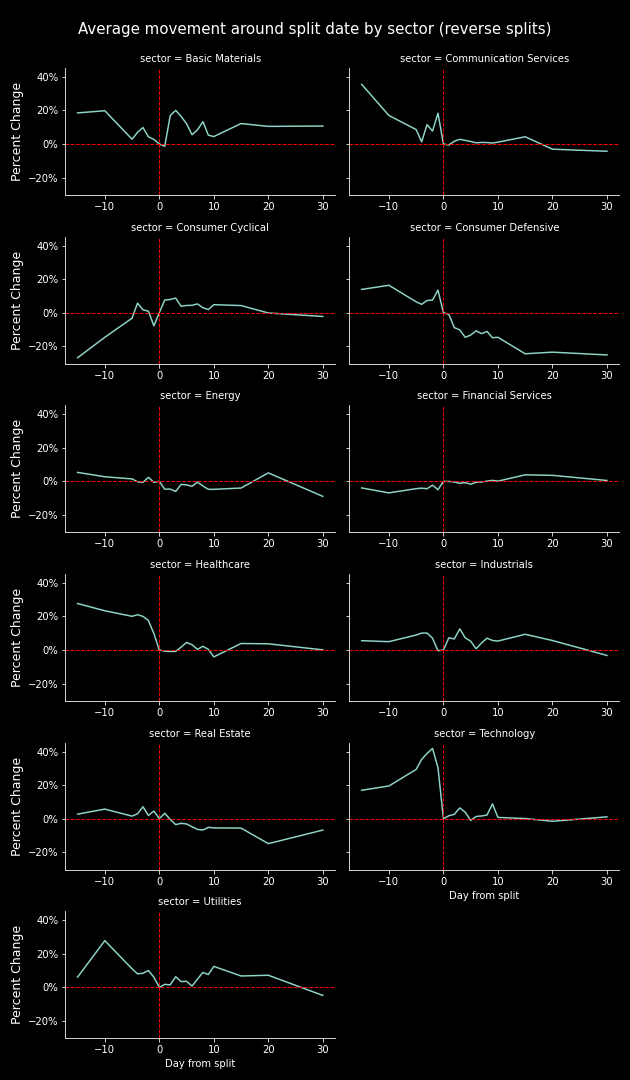
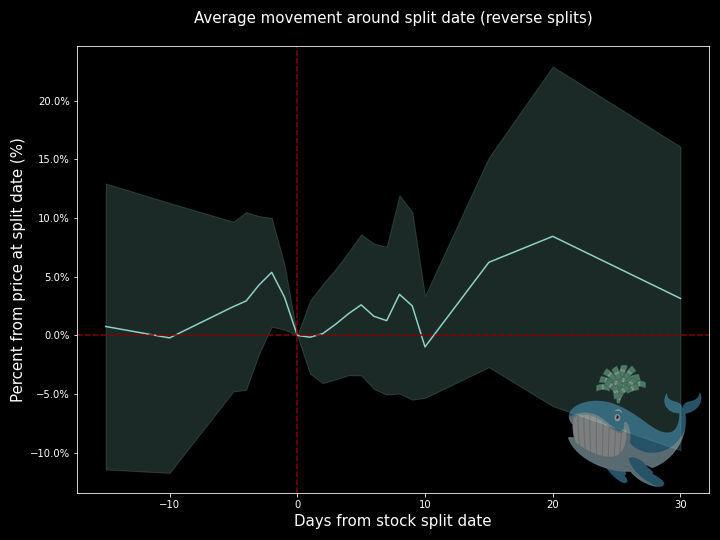
Following a reverse split, we see an average gain following of ~5% across sectors. However, the majority fell heading into the date of the split. Notably, Basic Materials and Industrials gained up to 20% and 10%, respectively, immediately following a reverse split.
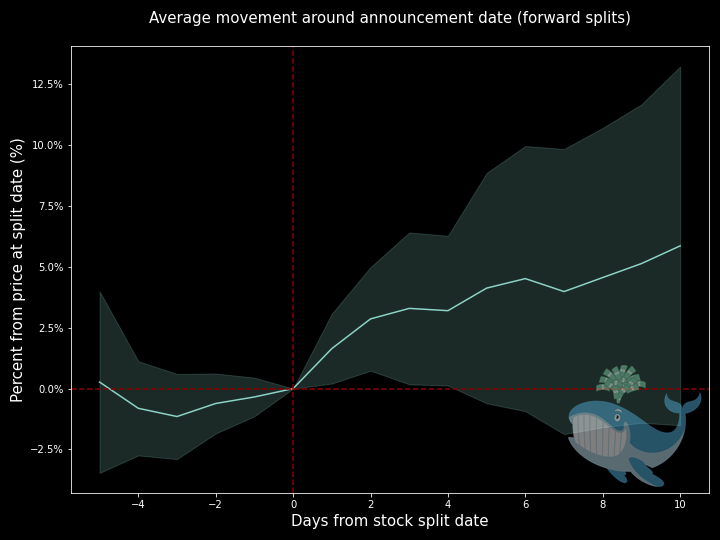
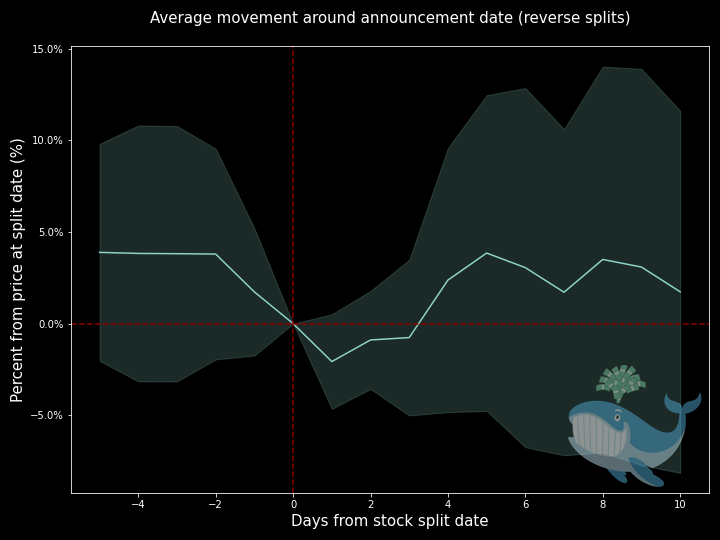
Average gain by announcement date
Average movement around announcement date, forward splits
Average movement around announcement date, reverse splits
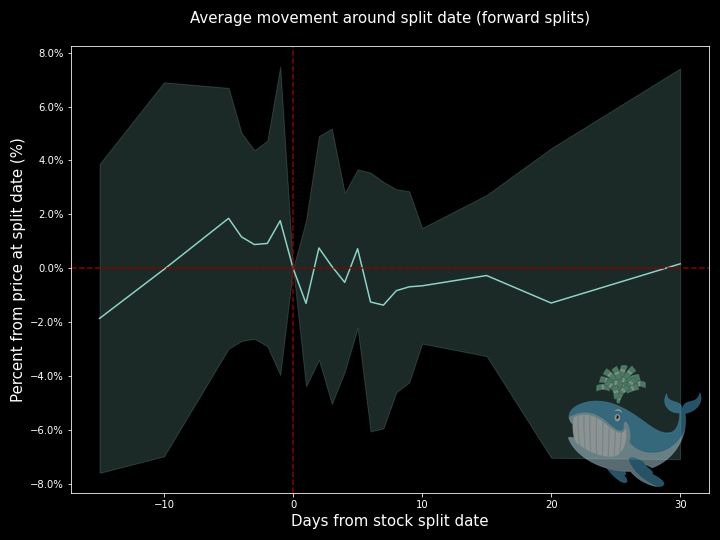
Average gain by split date
Average movement around near split date, forward splits.
Average movement around split date, reverse splits.
Encompassing both forward and reverse splits, regardless of sector or market cap, stocks in this dataset on average, trend upwards over time following the announcement of a split, and the actual split itself with the exception being forward splits after the split date itself.
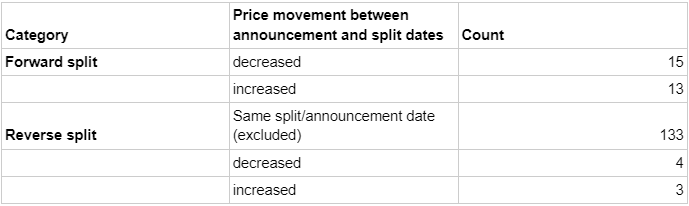
What happens to the stock between the split announcement and actual split date?
Since when a company announces a split is a gamble, and the split date is pre-determined and potentially priced in, where does that leave retail investors who hear the news?
In the dataframe, there were forward and reverse splits. The majority of tickers split on the same date, 80% of the dataframe, in fact, but where does that leave the remaining 20%?
How did each marketcap perform?
This table includes information regarding how forward and reverse splits moved, grouped by marketcap.
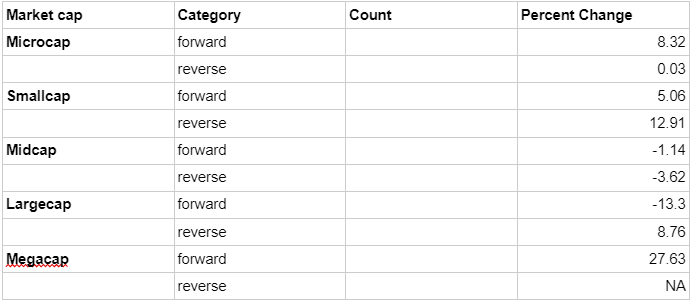
Per the data, forward splits on megacaps are overwhelmingly bullish, returning an average of 28% between announcement date and split date, however, the sample size is small (N=5)
How can I read the flow with this information?
Well, if you deem this data worthwhile, then you can most likely try to trade splits upcoming.
$NVDA
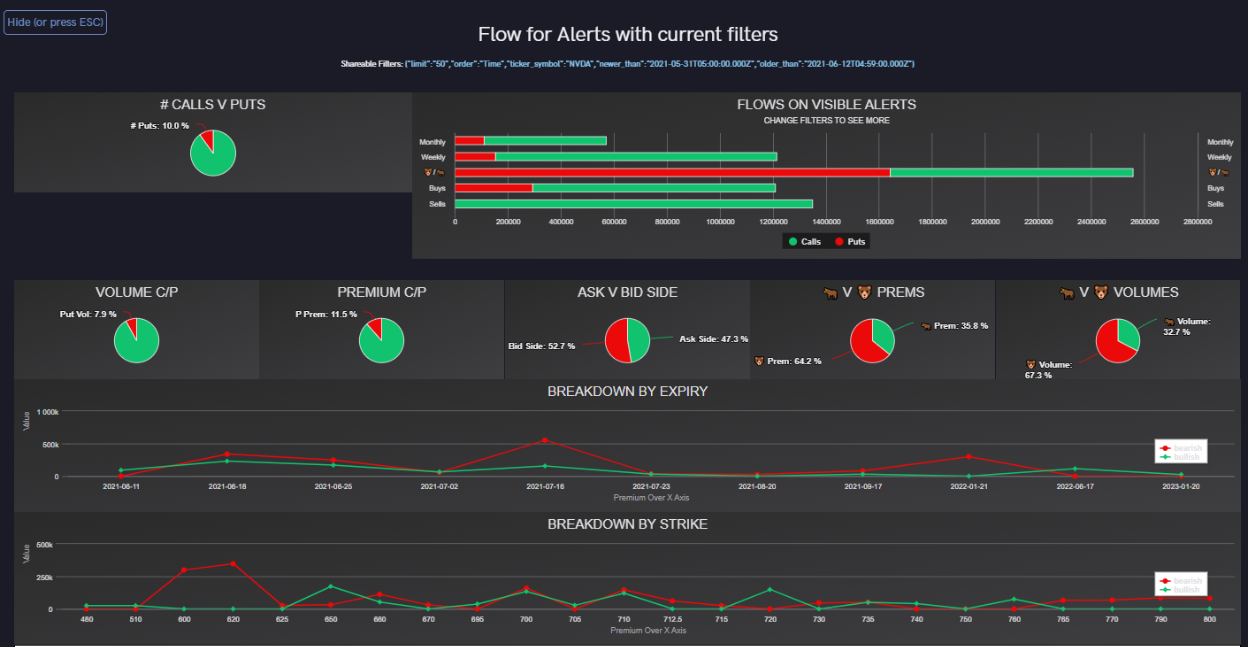
Here’s a look at the flow tool for the days before and after NVDA’s split announcement date. The flow is overwhelmingly bearish for the announcement, but what about after the split itself?
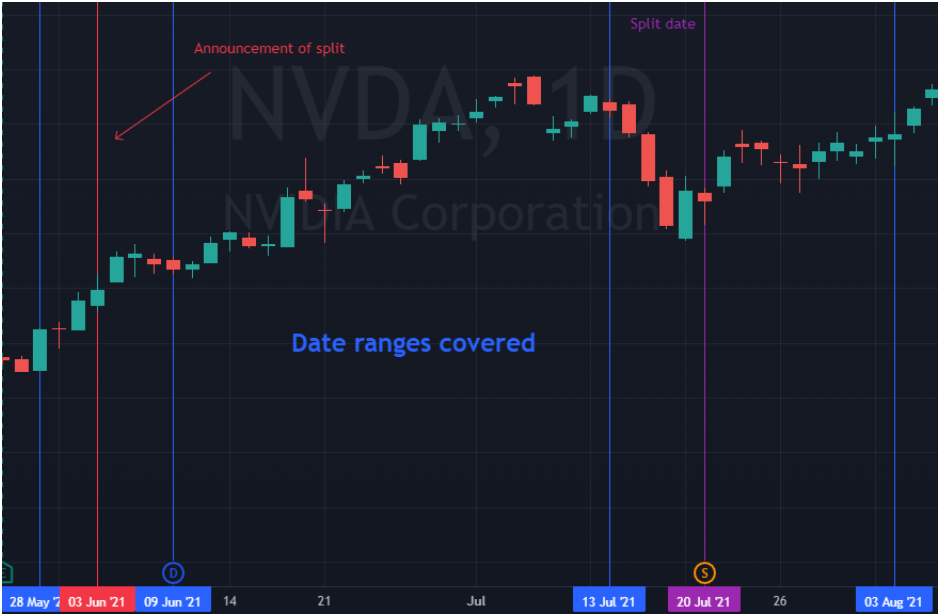
Let’s look at a date range of 5 days before the split date and 15 days after. NVDA split on July 20th, 2021. At the time, NVDA had been in a long downtrend, and the split on July 20th signaled a reversal in the stock, suggesting that investors viewed this split as bullish.
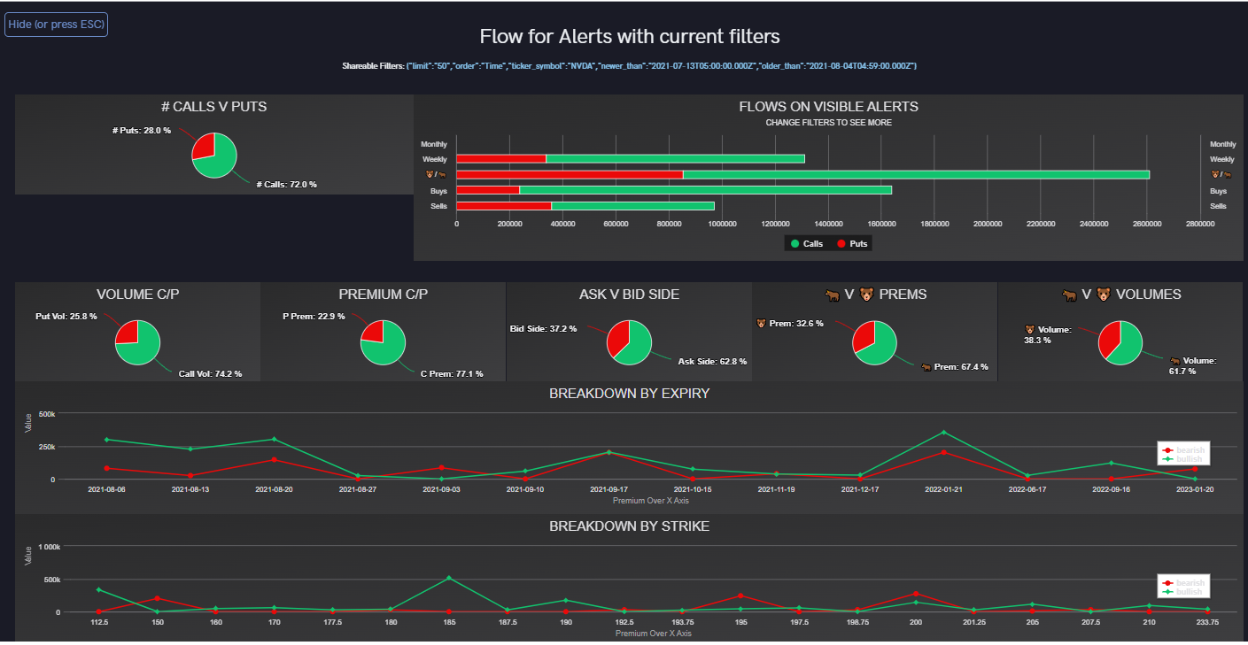
Data from that range suggests that the sentiment flipped greatly on NVDA heading into the split and post split, even though NVDA was mostly bullish throughout the period.
If you’d like to check these filters for yourself, click here. This will direct you to the historical flow page for NVDA, where you can see if there was any unusual activity around the split.
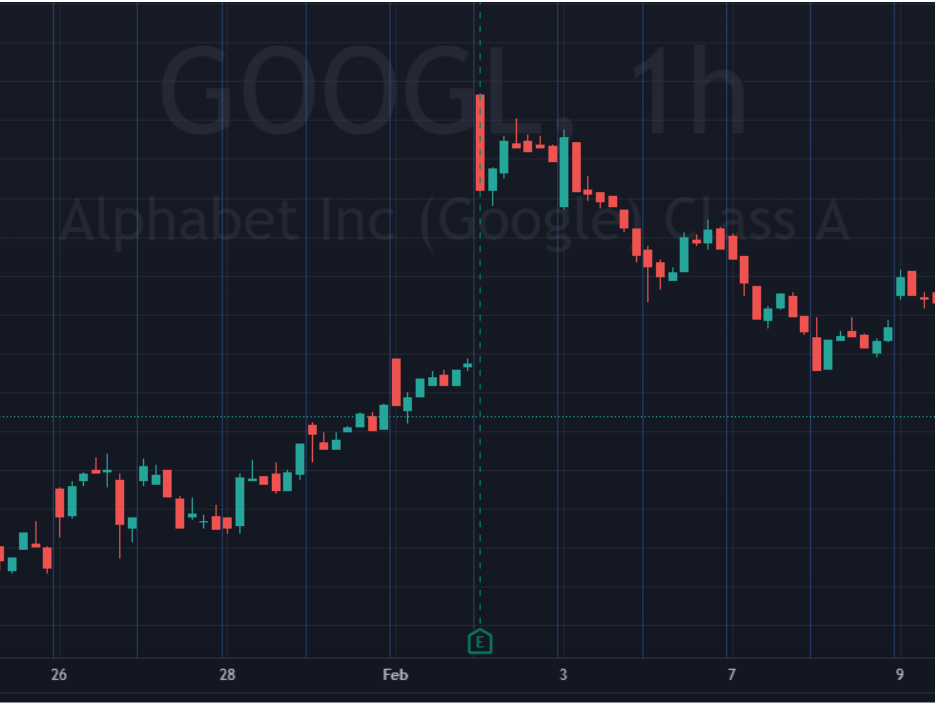
$GOOGL
Since Google’s split date is upcoming, we can only analyze movement around the announcement date, February 1st, 2022. This also happened to be an earnings date, so volatility was to be expected. Google’s earnings were good, it propelled the stock upward from ~$2750 to $3000, but the split was also announced on that date.
So, how did the flow look?
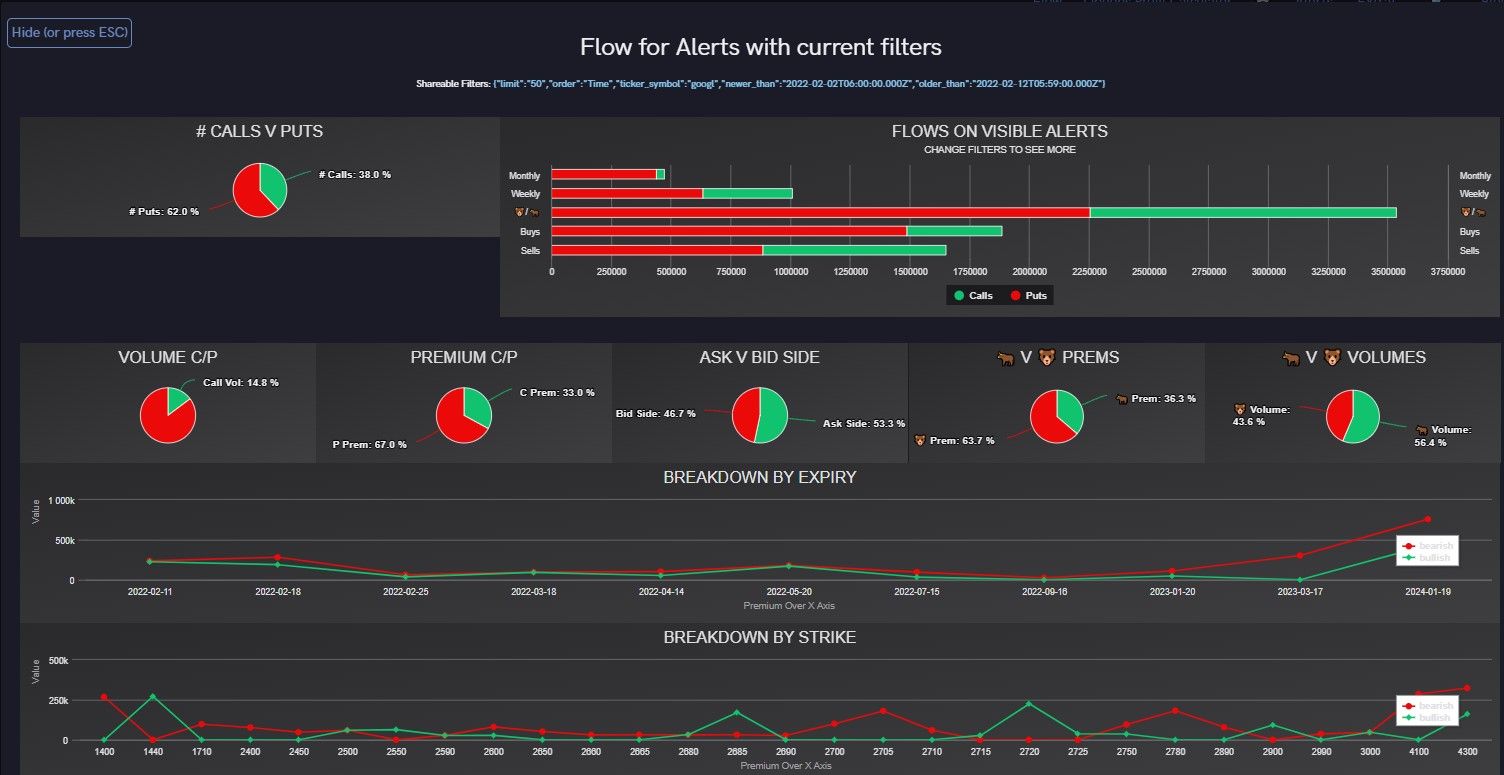
From a period of January 28th to February 12th, flow was leaning bearish, about 60%, so this certainly took some investors by surprise with their large beat and split announcement.
How about post-announcement/earnings? Did premiums or direction change?
Let’s check after February 1st.
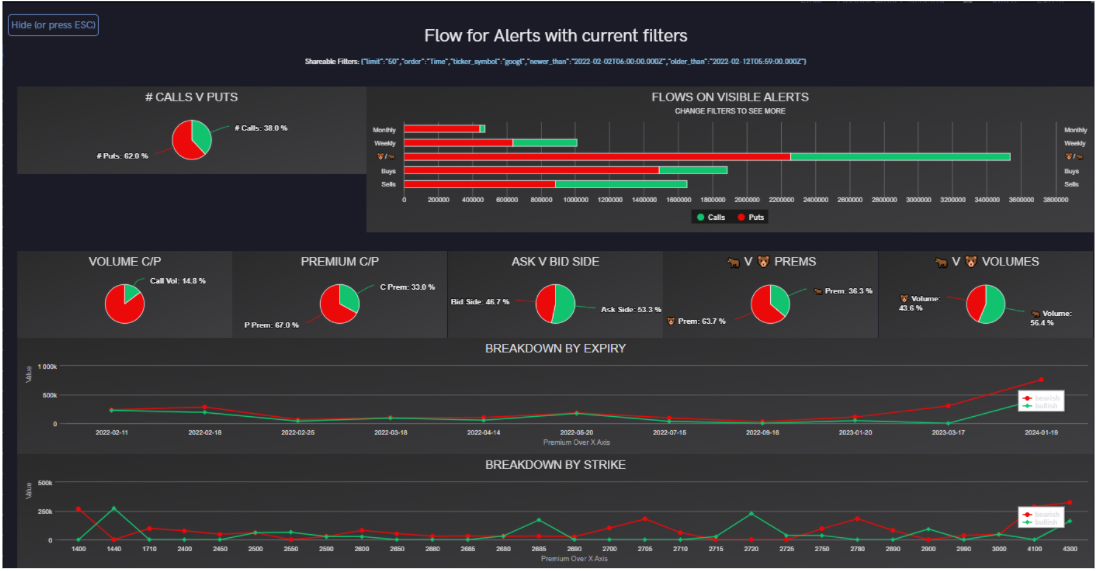
Interestingly, the flow stayed exactly the same. In fact, it feels like I’m looking at the same chart, but rest assured, these are different.
$AMZN
After market close on March 9th, 2022, Amazon, despite past protests from its founder Jeff Bezos, announced a 20:1 stock split.
Immediately following the announcement, AMZN shares jumped 10% in the after hours, after settling in at a 7% gain on the announcement.
So, how did the flow look the past week?
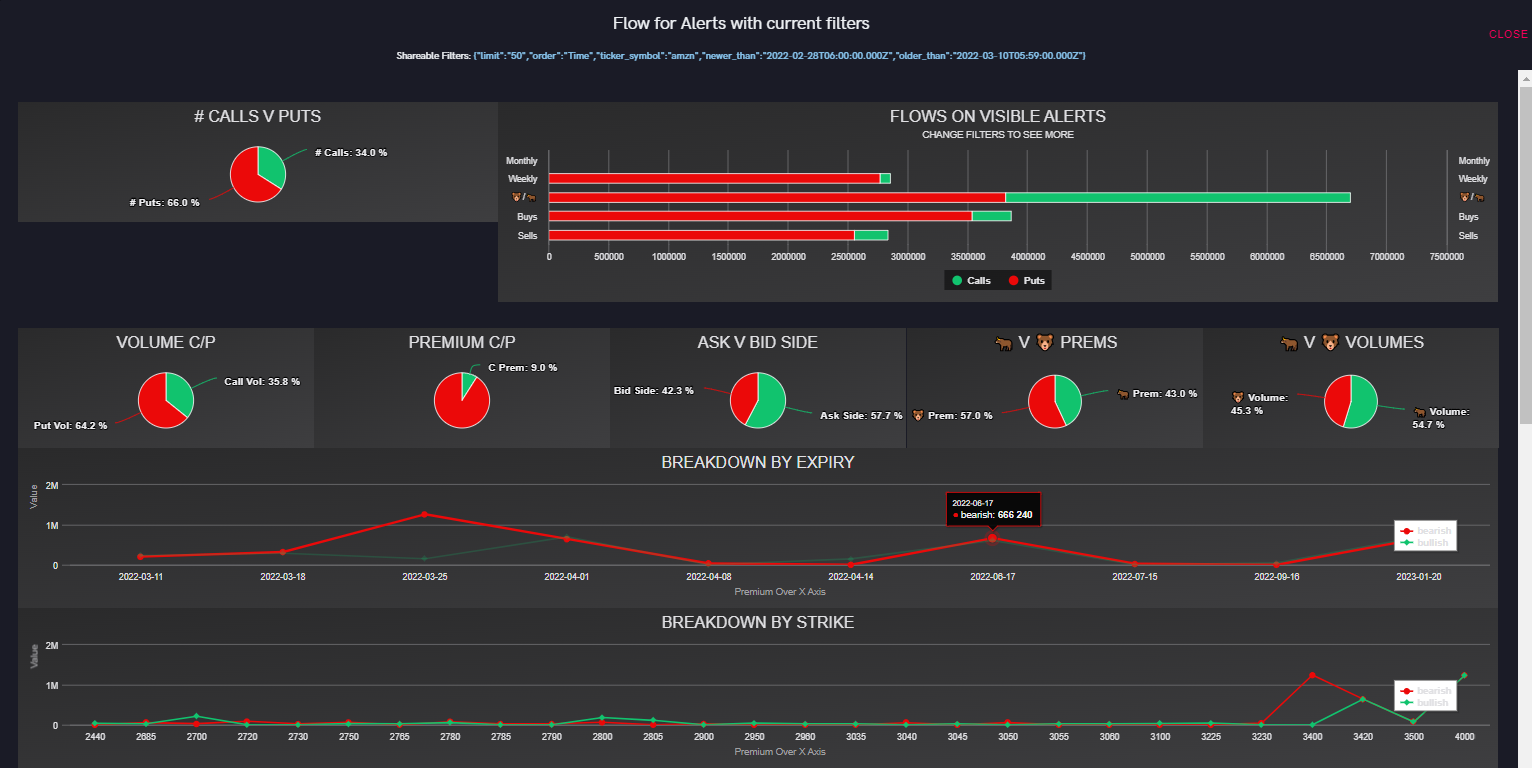
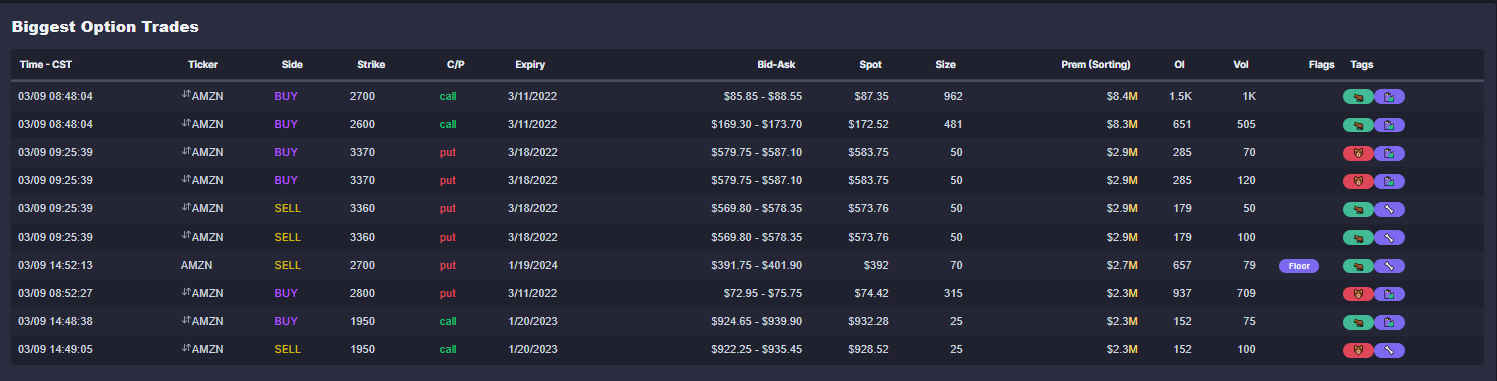
From a date range of February 28th until the day of the split, March 9th, AMZN flows were ask side primarily, with bullish volume, but primarily bearish leaning due to news driven events in recent weeks. Given this information, it doesn't seem like the general public-- or even insiders-- knew about AMZN's split.
However, there was a few large sized weekly DITM trades placed this morning, with two of them being over 8 million in premium.
Conclusion
Did Google’s split announcement cause the large gain? Was it their earnings report? It’s hard to tell, but shares did rise following the split announcement, so we have to assume it contributed.
But what is the overall theme here? Do stocks go up or down after announcement? Is the announcement bullish or bearish?
The general trend observed was that stock prices increased whenever a megacap or largecap announced a split, but decreased shortly after the split happened. However, with micro/small/midcap companies, there wasn’t an actionable trend observed.
What we do know, however, is that you can track the flow in real-time on our website, and see how whales are positioning heading into earnings, split dates, and many other catalysts. If you haven’t already, join our Discord to get started.
How would you play these splits with the flow? Feel free to DM me your responses on Twitter at @falcon_fintwit, along with any questions or comments, and make sure to follow @unusual_whales while you’re there too.