Unusual Options Activity on Ambarella Inc. (AMBA) Acts as Precursor to This Week's Run
Ambarella Inc. (NASDAQ:AMBA) has been on a strong bull trend this year. In fact, in the last 6 months, the low-power, high-definition semiconductor design company is up an astounding $69.45 to a share price of $173.51 More impressive is the fact that the majority of this jump occurred within the last month and a half or so, given the stock closed at a price of $103.57 on August 31st.
In recent days, AMBA has begun seeing unusual options activity once again.
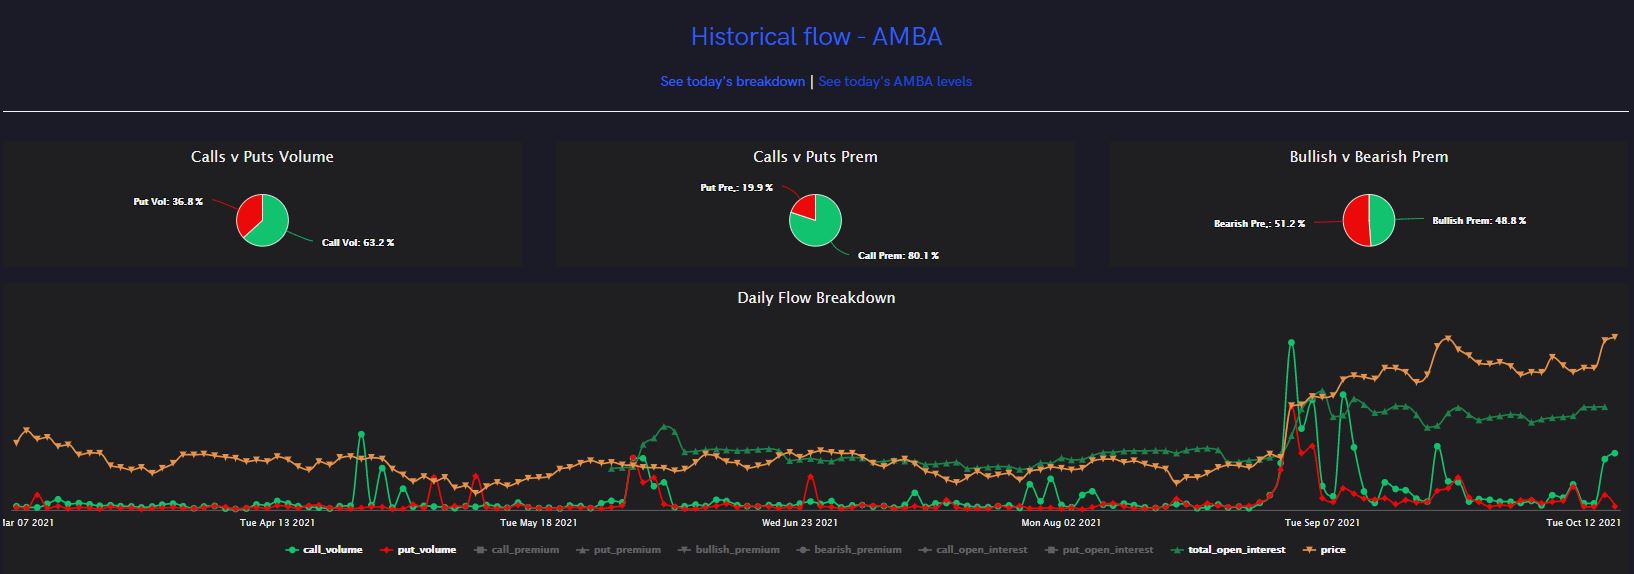
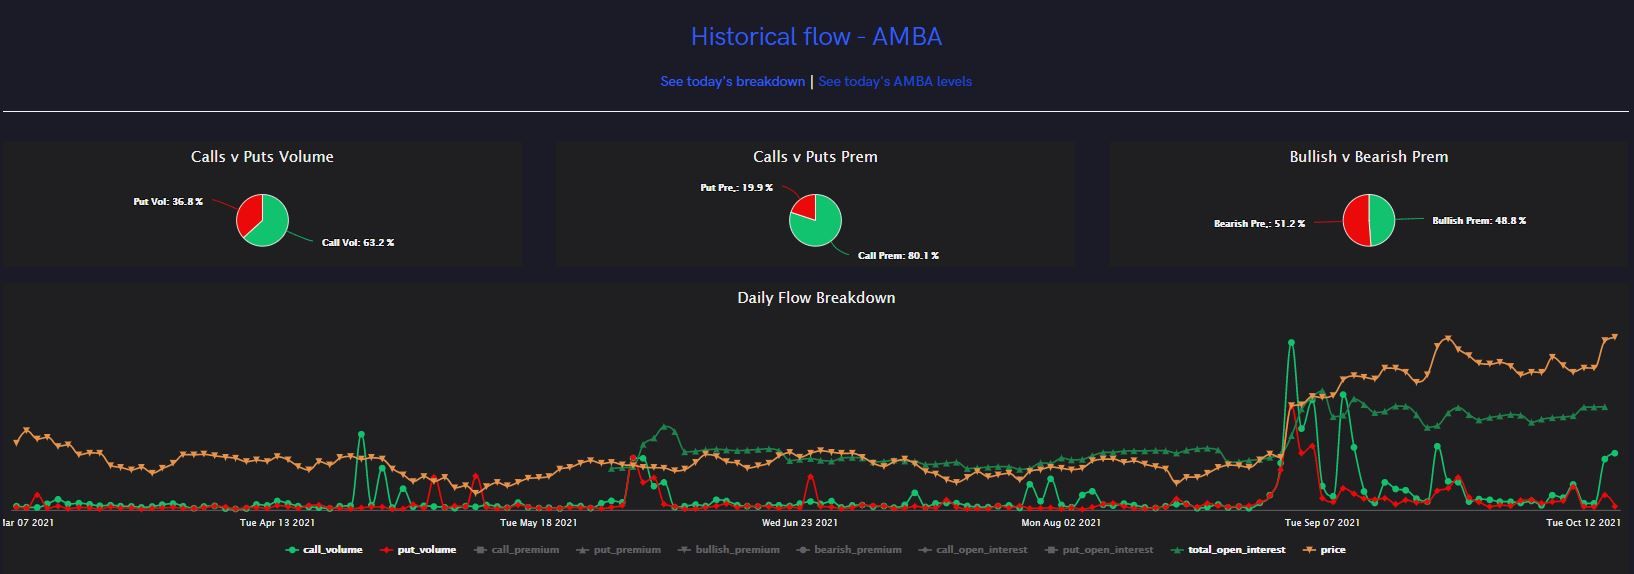
In the historical options volume chart, there was clearly an options frenzy when AMBA experienced that large pop, right around the time the stock shot up a significant amount from that $103.57 close on August 31st.
Throughout the first half of September, we see a few more blips, followed by stagnant volume for the rest of the month into October. Starting on Wednesday, October 14th, on the far right of the chart, we can see that line starting to edge upward once again.
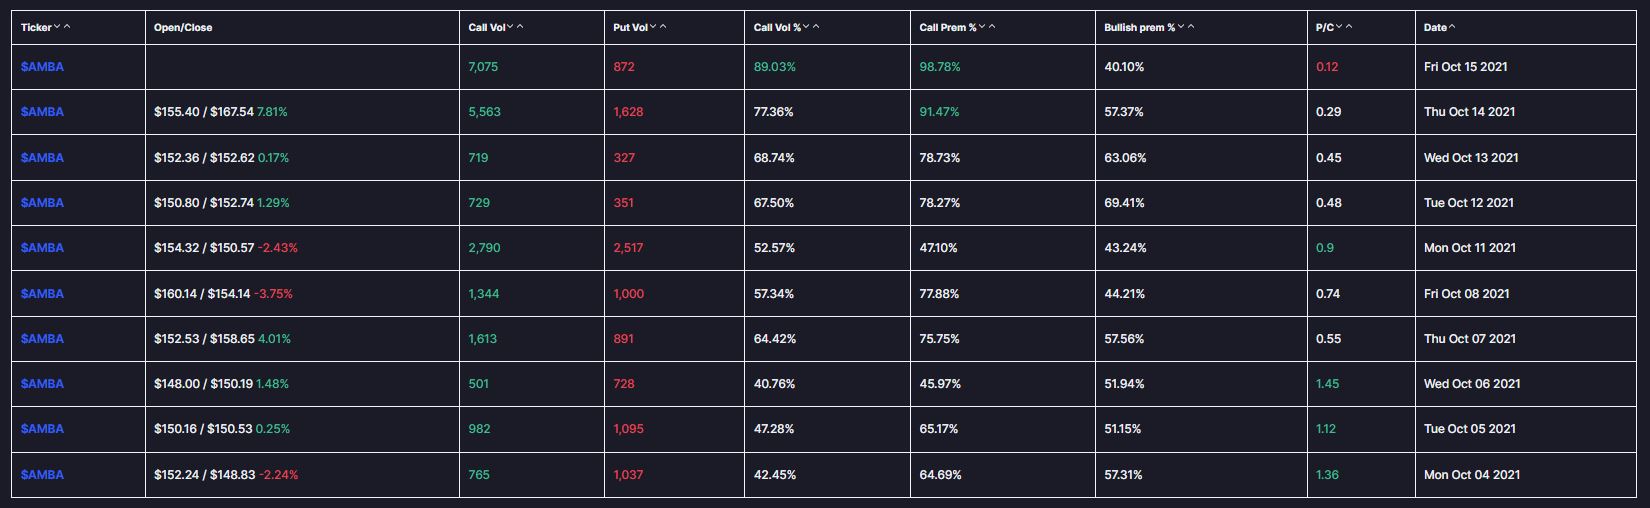
As shown above, the overall options volume for AMBA prior to October 14th stayed within a range of less than 1,000 call options traded to a peak of 2,790 call options traded on October 11th. Then, on October 14th, total call options traded hiked up to over 5,500, and today, it’s already over 7,000 call volume just within the first hour of trading. This is absolutely reflected in the stock price as well.
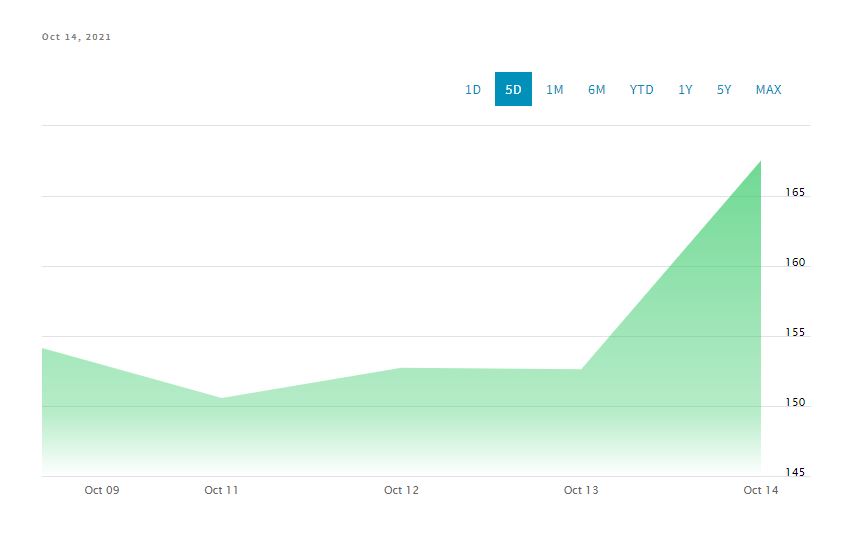
In the chart above, sourced from Nasdaq, is the 5 day stock price movement for Ambarella. Following low options volume on October 13th, AMBA closed at $152.62. On Thursday, October 14th, AMBA opened at $155.40, which is where we see the hike in options volume begin.
Then AMBA made a major move into the afternoon, reaching a daily high of $168.93 before settling down and closing the Thursday trading session at $167.54. The options flow began before this price action, as we’ve become accustomed to seeing.
This poses the question; what did that options flow look like? Well, it won’t surprise you to discover that the flow prior to this pop, the options volume throughout the day on October 14th, was predominantly bullish.
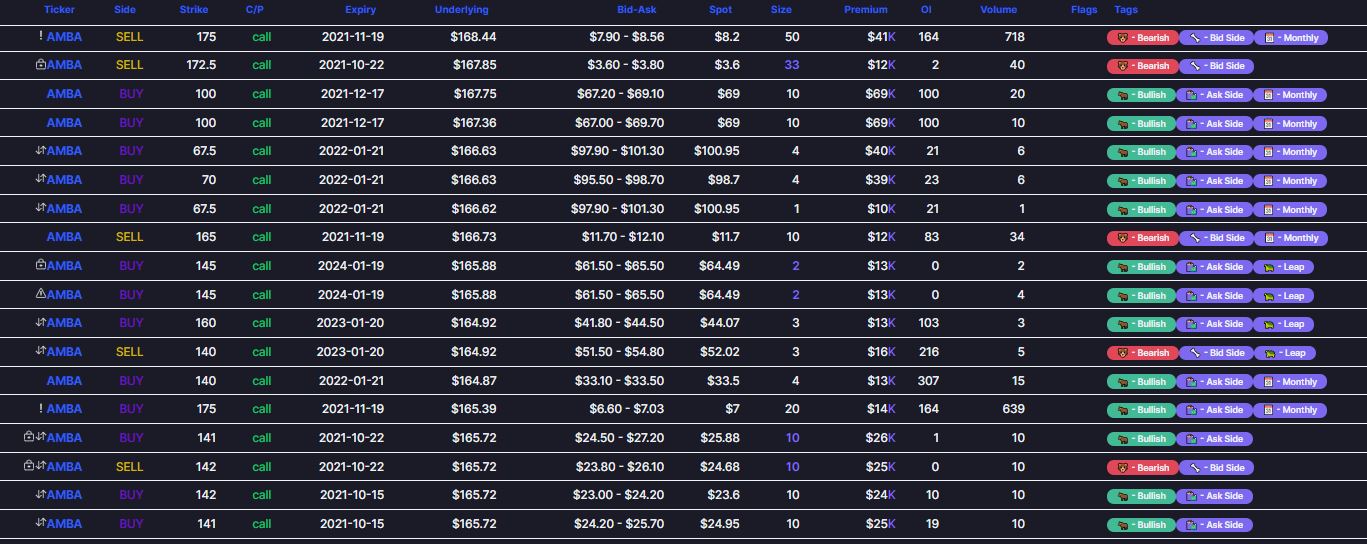
Although many trades came in with a short time frame, most of the flow for AMBA on October 14th revolved around longer dated options. The $145 call strike for January 2024 was a popular target, for example.
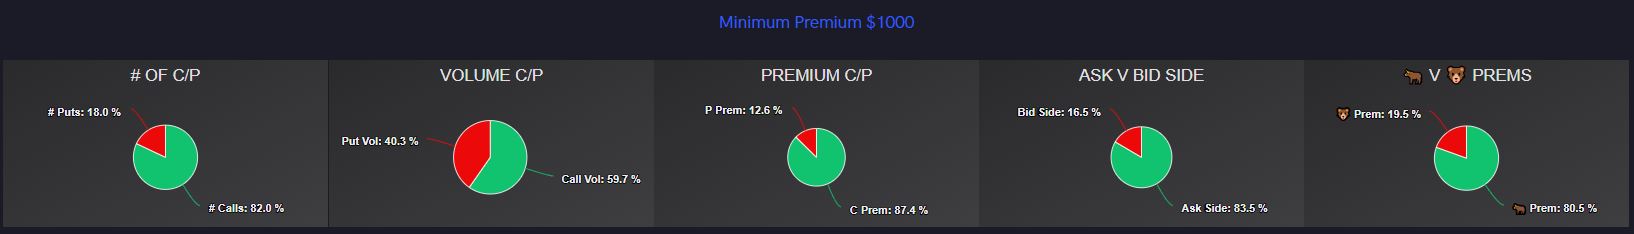
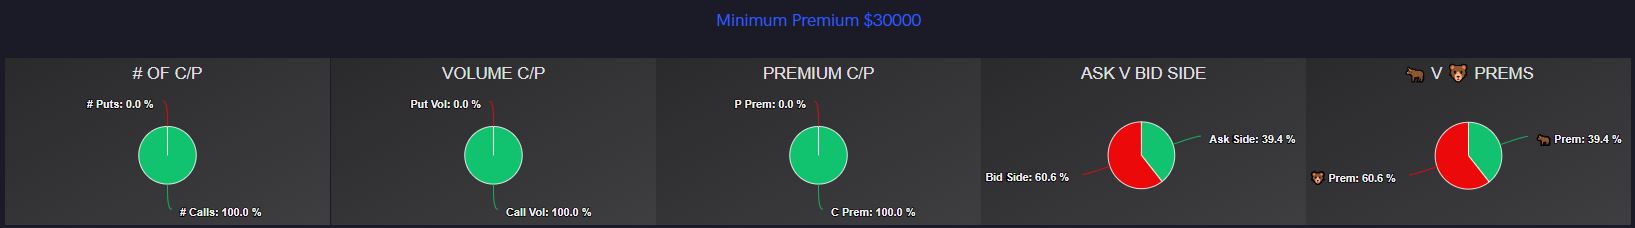
Today’s flow, after this strong push to today’s high of $173.51 (an additional +4.82% push) shows less bullish sentiment. Orders with a minimum premium of $1k show 80.5% bullish; however, orders with a minimum premium of $30k shows only 39.1% bullish. This could indicate that bigger players are more tentative now after the pop than they were on the 14th.